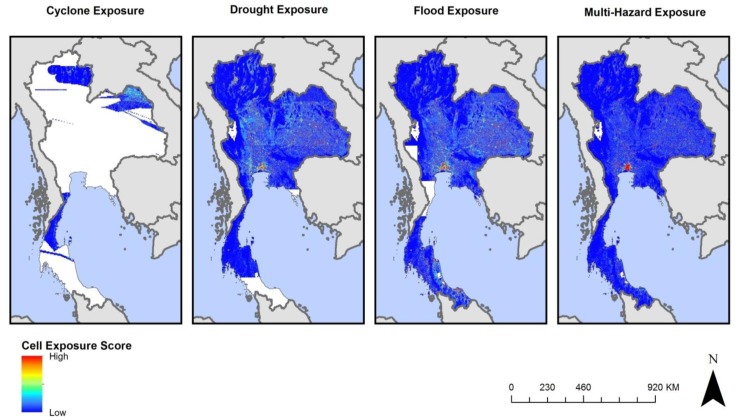
Figure 3.
Cyclone, drought, flood, and multi-hazard cell exposure scores for Thailand. The concentration of high exposure (red) in Bangkok represents higher population exposure due to the concentration of population in that area, not necessarily higher population exposure. White areas in Thailand represent locations where no hazard events were reported by CHRR in the period of analysis.

