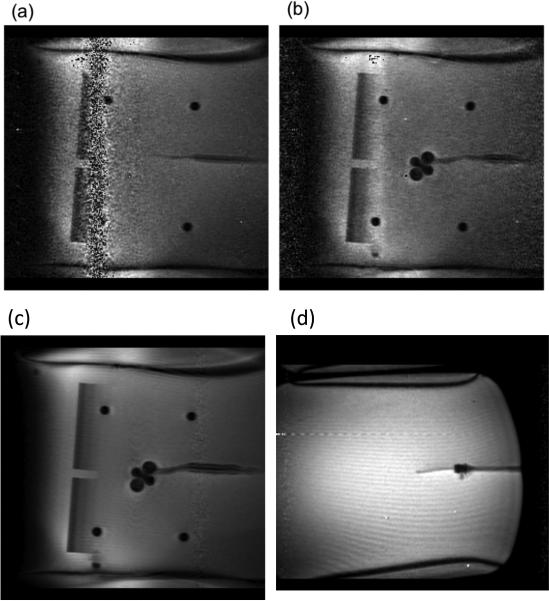
Fig. 5.
MR images of the MARC catheter in a phantom, taken with SSFP sequence with TR of 3.9, TE of 1.35 and 60 degree flip angle. (A) When the catheter is connected to the control module, a band artifact is captured along the frequency encode axis, representing a distinct band of noise ~64 MHz. (B) When the catheter solenoid is energized with current, the band artifact disappears, and a clover shaped artifact appears at the catheter tip. (C) The rheostat power source while energizing the MARC catheter produces less diffuse noise, and a subtle band of frequency related noise. Coils were energized to 300 mA in B and C. (D) The frequency band artifact is significantly reduced after isolation of coil leads. A new subtle single line artifact is observed after cleaning up the band frequency artifact and diffuse noise.

