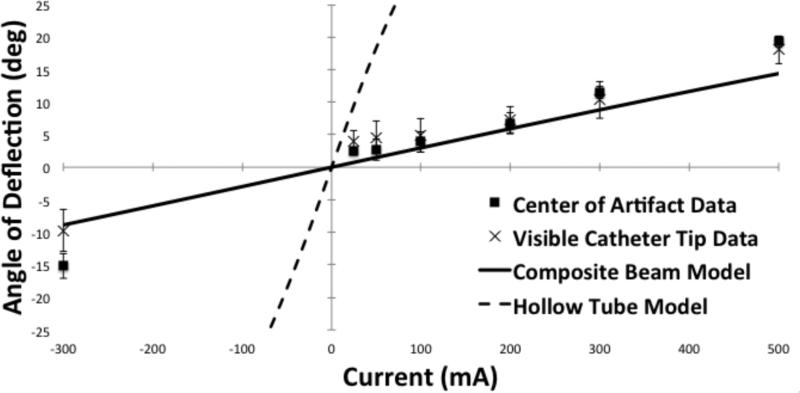
Fig. 7.
Deflection data fit to two different models of catheter mechanical elasticity. The least squares regression fit of the catheter data to the composite beam model, using the addition of copper wire, is shown in the solid line, and correlation with the deflection data measured using the visible catheter tip (R2 = 0.88) and the center of the catheter artifact (R2 = 0.88). The least squares regression fit of the catheter data to a simple hollow tube is shown with the dashed line and has little correlation with measured deflection data (R2 < .01 both techniques of angular deflection measurement).

