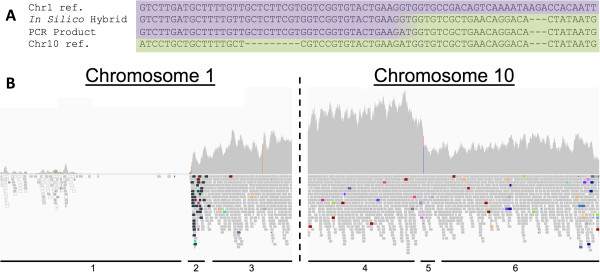
Figure 6.
Recombination events detected in long term culture samples. A. Reassembled sequences from recombination events indicate a splicing of 56,000 base pairs from the left sub-telomeric region of chromosome 1 on to the right sub-telomeric region of chromosome 10. The center sequence is the assembled recombination from the sequencing data, while the top and bottom are the respective reference sequences for each of the indicated chromosomal regions. Note the clear transition between alignments. B. Read pileup for the two regions containing the predicted recombination. Note the deletion (region 1) on chromosome 1 next to the breakpoint (region 2) and subsequent normal coverage (region 3). Similarly, chromosome 10 shows an amplification event (region 4) next to the breakpoint (region 5) and then subsequent normal alignment (region 6).

