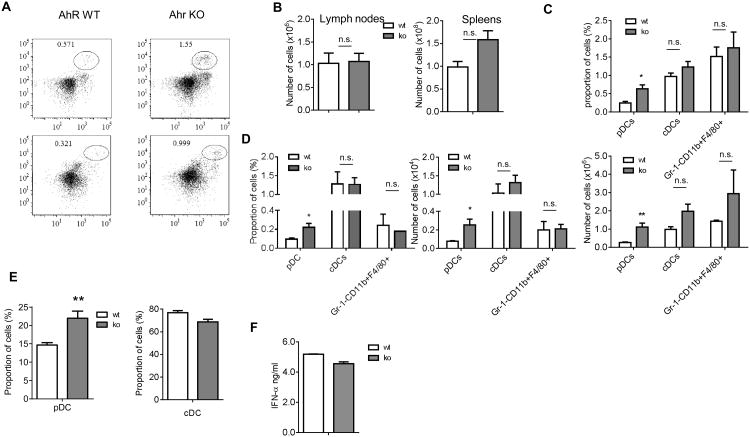
Figure 1. AhR KO mice show the selective accumulation of pDCs in peripheral lymphoid organs.
A. Typical example of staining the splenocytes from AhR KO and WT mice. The cells in the circle gate represent pDCs. B. The absolute number of cells in lymph nodes and spleens. Data are presented as Mean ± SEM (n=3 mice). C, D. The percentage and total cell number of different myeloid cells in spleens (C) and LNs (D) from AhR KO and control WT mice. Data are presented as Mean ± SEM (n=3 mice). *, p<0.05, **, p<0.01, compared to the WT mice. E. Enriched BM HPCs from AhR KO or WT mice were cultured with 100 ng/ml Flt3L for 9 days. The representative FACS plots from 3 independent experiments show the expression of B220 vs CD11c among live CD11b- cells. Data are presented as Mean ± SEM (left). **, p<0.01, compared to WT mice. F. 50,000 of Siglec H+ cells from 9 days' BM cultures of HPC with Flt3L were stimulated with 20ng/ml CpG ODN type A for 18 hr. Data show the production of IFN-α measured in ELISA. Data are presented as Mean ± SEM of three independent experiments.

