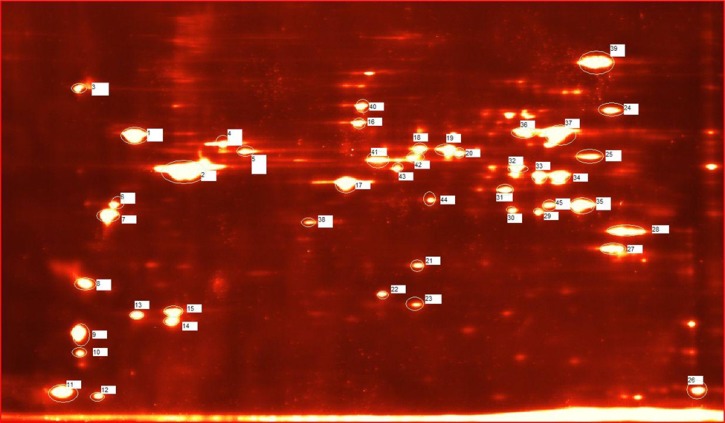
Figure 1.
Analyzed protein spots. Representative Ae. aegypti salivary gland extract two-dimensional gel image (12.5% Tris·HCl in TGS buffer using a pH 3–10 non-linear IPG strip) with the spots cut and numbered according to the MS data included in Supplementary Information.

