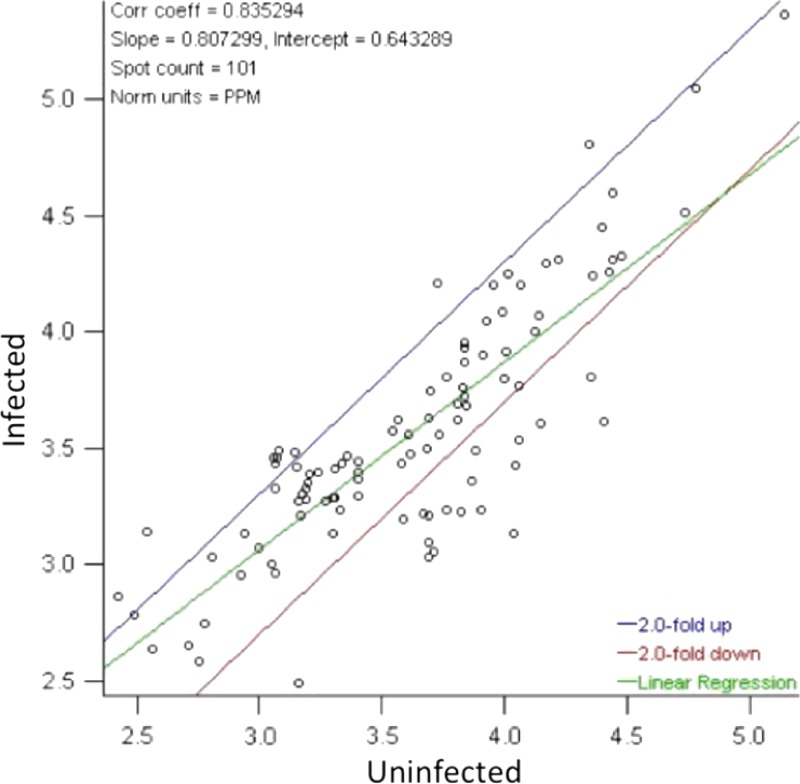
Figure 2.
Regression of normalized protein spot intensities comparing infected with uninfected Ae. aegypti salivary gland protein extracts. Protein spots located outside of the twofold differential regulation bounds (blue and red lines) correspond to a greater than twofold change in protein spot intensity between the treatments. The average linear relationship of the infected:uninfected protein spot intensities is given by the linear regression line (green) and indicates that infected salivary gland extract (SGE) has 20% less spot intensity than the uninfected group (regression slope = 0.807).

