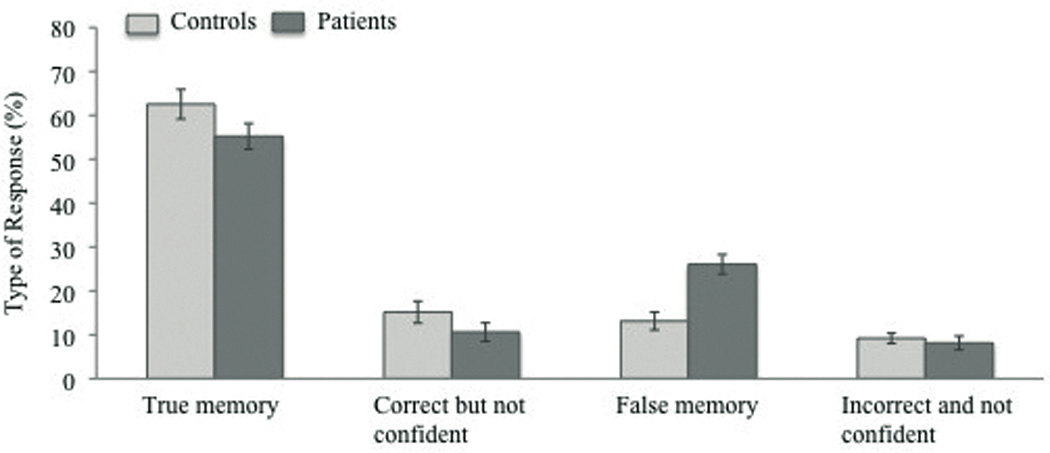
Figure 3.

Percentage of response types across conditions for healthy controls and schizophrenic patients. Vertical bars represent the standard error of the mean.

Percentage of response types across conditions for healthy controls and schizophrenic patients. Vertical bars represent the standard error of the mean.