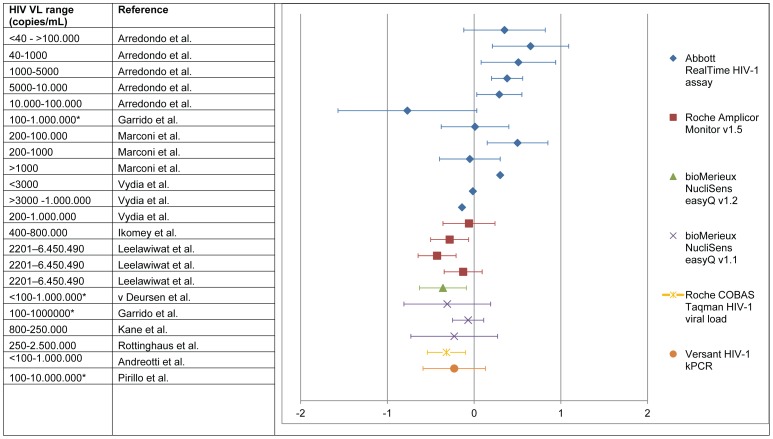
Figure 2. Bias* per HIV viral load range, given for each assay.
a haematocrit corrected. b viral load adjusted for smaller input volume. c standard haematocrit value used to correct. * data obtained from Bland-Altman figures. *Bias (DBS-plasma) was plotted as the mean with 1 standard deviation (SD). A negative value represents an HIV VL underestimation compared to plasma while a positive HIV VL bias represents an overestimation of the HIV VL compared to plasma. SD was recalculated to 1 SD when presented as 1.96 or 2SD. In case of bias discrepancy between the text and Bland Altman figure, the bias noted in the text was used (15).

