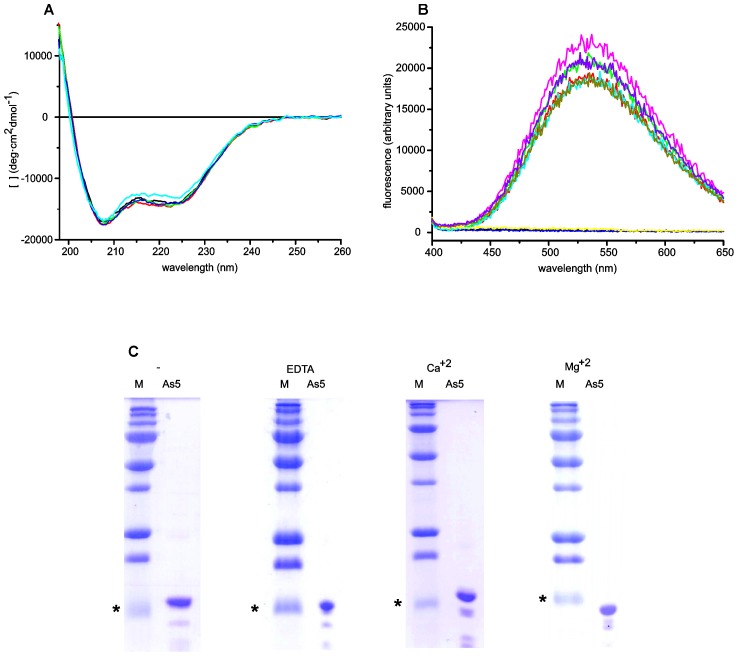
Figure 3. Biophysical characterization of Ani s 5 and effect of divalent cations.
A, Far-UV CD spectra of Ani s 5 in the absence (black) or in the presence of different cation concentrations: red, MgCl2 2 mM; green, MgCl2 20 mM; blue, MgCl2 100 mM; cyan, CaCl2 100 mM at pH 7. B, Fluorescence emission spectra after excitation at 350 nm of Ani s 5 (black), ANS (red), Ani s 5 with CaCl2 (dark blue), Ani s 5 with MgCl2 (yellow), ANS with Ani s 5 (green), ANS with CaCl2 (cyan), ANS with MgCl2 (olive green), Ani s 5 with ANS and CaCl2 (magenta), and Ani s 5 with ANS and MgCl2 (violet). C, SDS-PAGE of Ani s 5, Ani s 5 with EDTA, 2 mM CaCl2 or 2 mM MgCl2 2. M denotes the molecular weight markers used and the asterisks indicate the 15 kDa standard.

