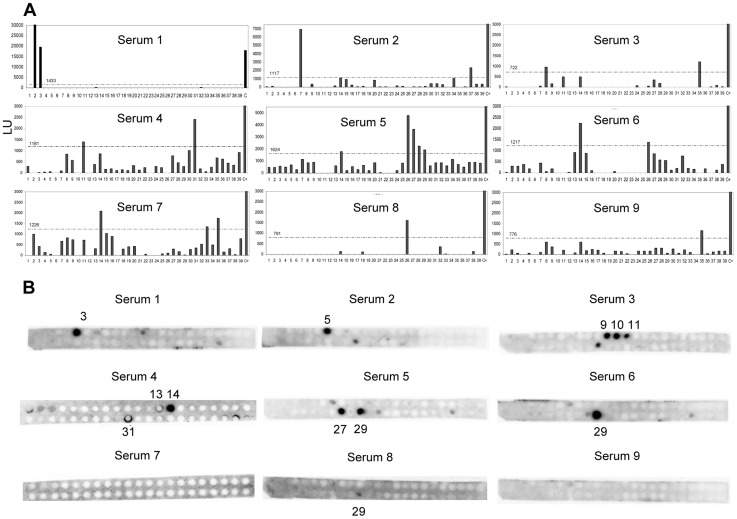
Figure 4. IgE binding epitope characterization.
A, Average signal intensity (in light units) of the peptide-based microarray immunoassay for the nine Ani s 5 positive sera tested, cut-off values are indicated above the dotted line. B, IgE immunodetection of SPOTs membranes for the same nine Ani s 5 positive sera.

