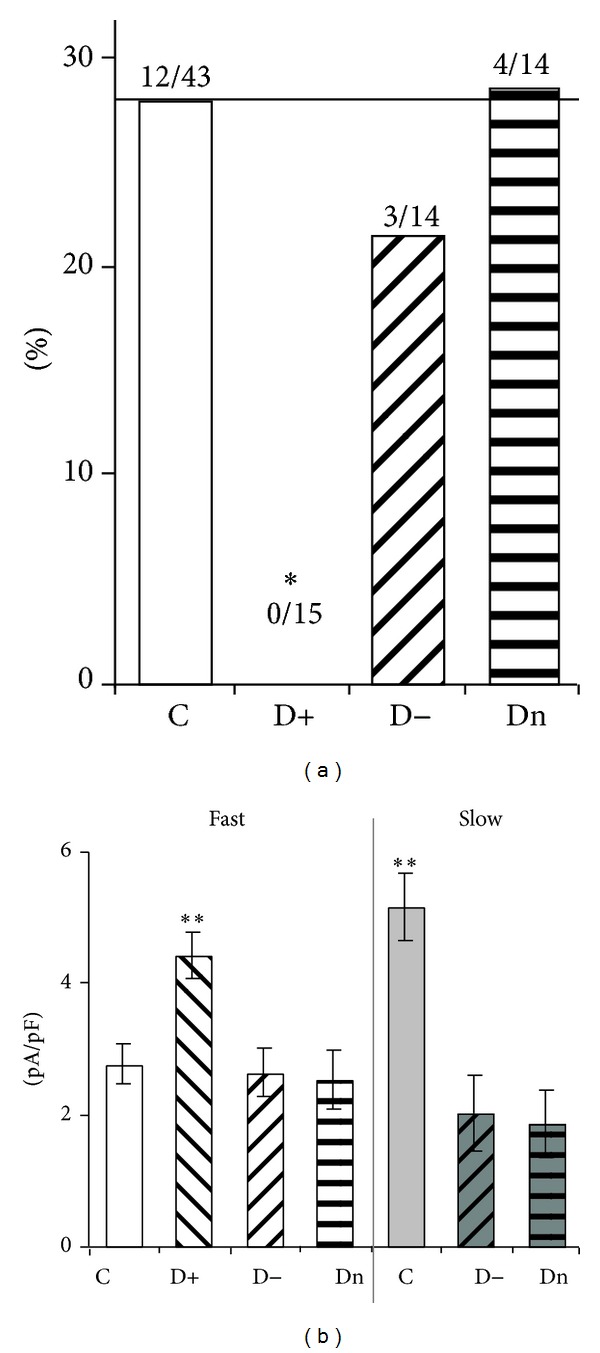
Figure 3.

Functional expression of fast and slow T-currents in NTCN neurons under different PDN conditions. (a) Percentage of NTCN neurons revealing the slow T-current in control (C), hyper- (D+), hypo- (D−), and normalgesic (Dn) groups. The slow T-current was not observed under hyperalgesic conditions, *P < 0.05 (Fisher's exact test). The numbers above the columns indicate the number of NTCN neurons expressing the slow T-current of the total number of tested neurons in the respective group. (b) PCD of fast and slow T-currents under the control and PDN conditions. It is interesting to note that the fast T-current was upregulated in hyperalgesic conditions while the slow T-current was strongly downregulated in norm- and hypoalgesia. Each column was the mean and SEM from number of neurons specified in (a). **P < 0.01 (ANOVA). n.s.: not significant (ANOVA).
