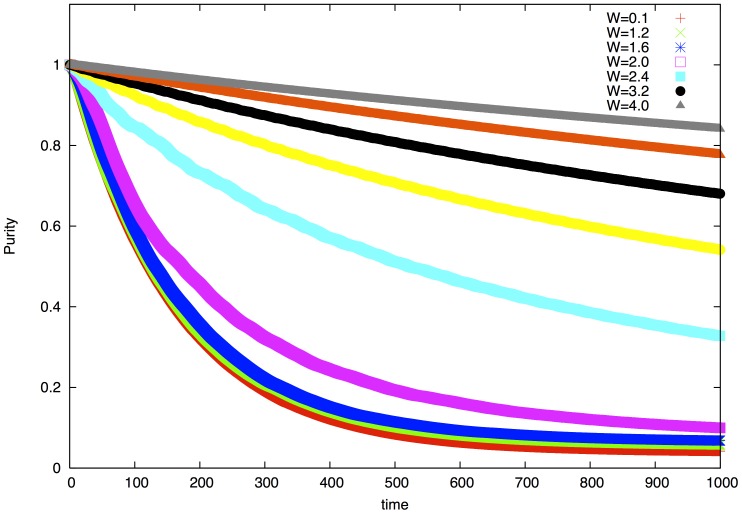
Figure 1. Purity decay of the chromophore ring with 1D Harper hamiltonian.
Below the metal-insulator transition  curves can be fitted with exponentials
  . In the parameter range
  the fitted coherence time changes in the range
  . In and above the transition
  the curves can be fitted with
  . In the parameter range
  the exponent changes in the range
  and
and  . The estimate for the decoherence time
  above the transition is
  .
.

