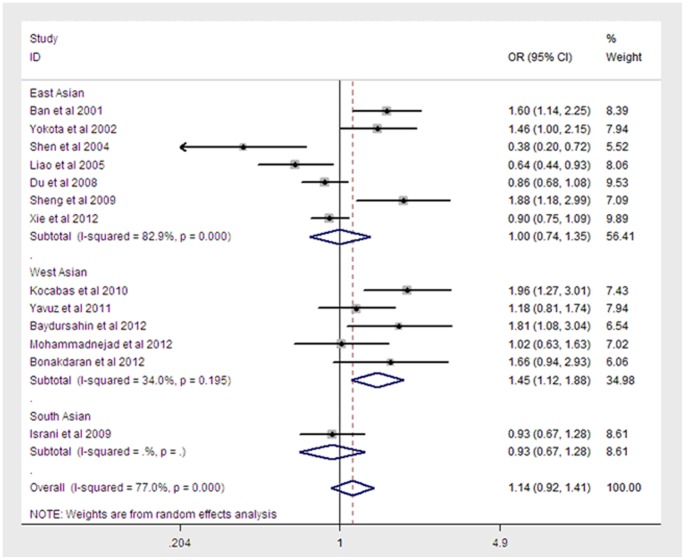
Figure 3. Meta-analysis for the association between T1DM risk and the VDR FokI polymorphism(F vs f).
Each study was shown by a point estimate of the effect size (OR) (size inversely proportional to its variance) and its 95% confidence interval (95%CI) (horizontal lines). The white diamond denotes the pooled OR.

