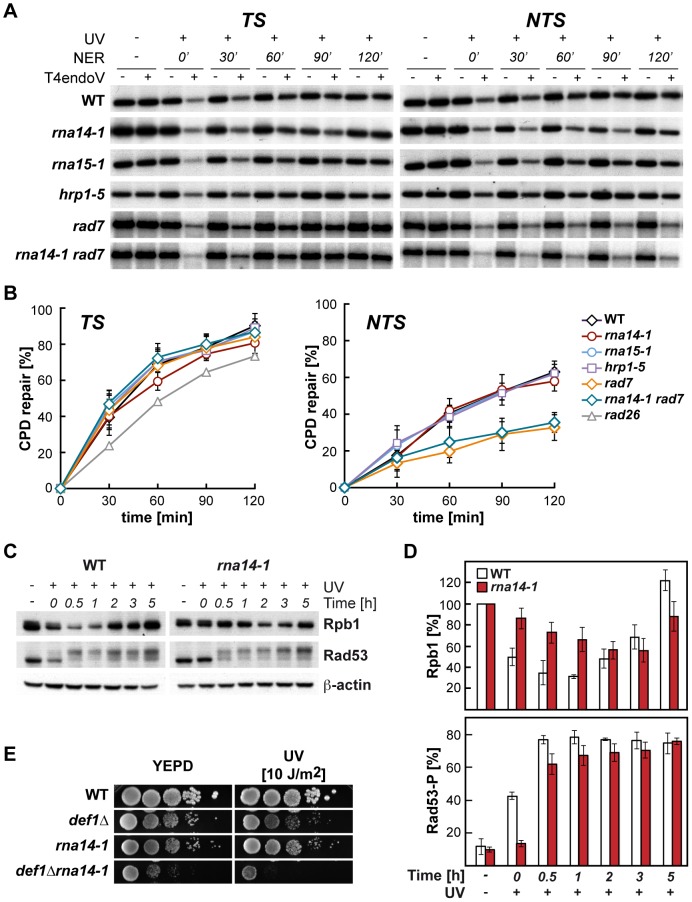
Figure 2. Normal CPD repair and DNA-damage response alteration in transcription termination mutants.
(A) Southern analysis showing repair of a 4.4-kb (NsiI/PvuI) RPB2 fragment in wild-type, rna14-1, rna15-1, hrp1-5, rad7Δ and rna14-1 rad7Δ cells. Initial damage was on the average 0.247±0.091 CPD/Kb in the transcribed strand (TS, left) and 0.245±0.098 CPD/Kb in the non-transcribed strand (NTS, right). The remaining intact restriction fragment after treatment with T4endoV (+UV, +T4endoV) corresponds to the fraction of undamaged DNA. Non-irradiated DNA (-UV) and DNA not treated with T4endoV (-T4endoV) were used as controls. (B) Graphical representation of the quantified results. The CPD content was calculated using the Poisson expression, -ln (RFa/RFb), where RFa and RFb represent the intact restriction fragment signal intensities of the T4endoV- and mock-treated DNA, respectively. Repair curves were calculated as the fraction of CPDs removed vs. repair time. Average values derived from three independent experiments are plotted with their standard deviation. Repair curve of rad26 (data taken from [9]) is depicted for the TS. (C) Western analysis of Rpb1 and Rad53 upon UV irradiation in rna14-1 and wild-type cells. β-actin is shown as loading control. (D) Graphical representation of the quantified results from Rpb1 and Rad53 Western analyses. The amount of Rpb1 is shown as the percentage of Rpb1 in the non-irradiated sample. The percentage of hyper-phosphorylated Rad53 is plotted for each condition. Average values derived from three independent experiments are plotted with their standard deviation. (E) Genetic interaction analysis between the rna14-1 and the def1Δ mutants. Serial dilutions (10-fold) of exponentially growing cultures are shown. This panel complemented with the data of the rna15-1 def1Δ, hrp1-5 def1Δ, and rat1-1 def1Δ mutants are shown in Figure S2.

