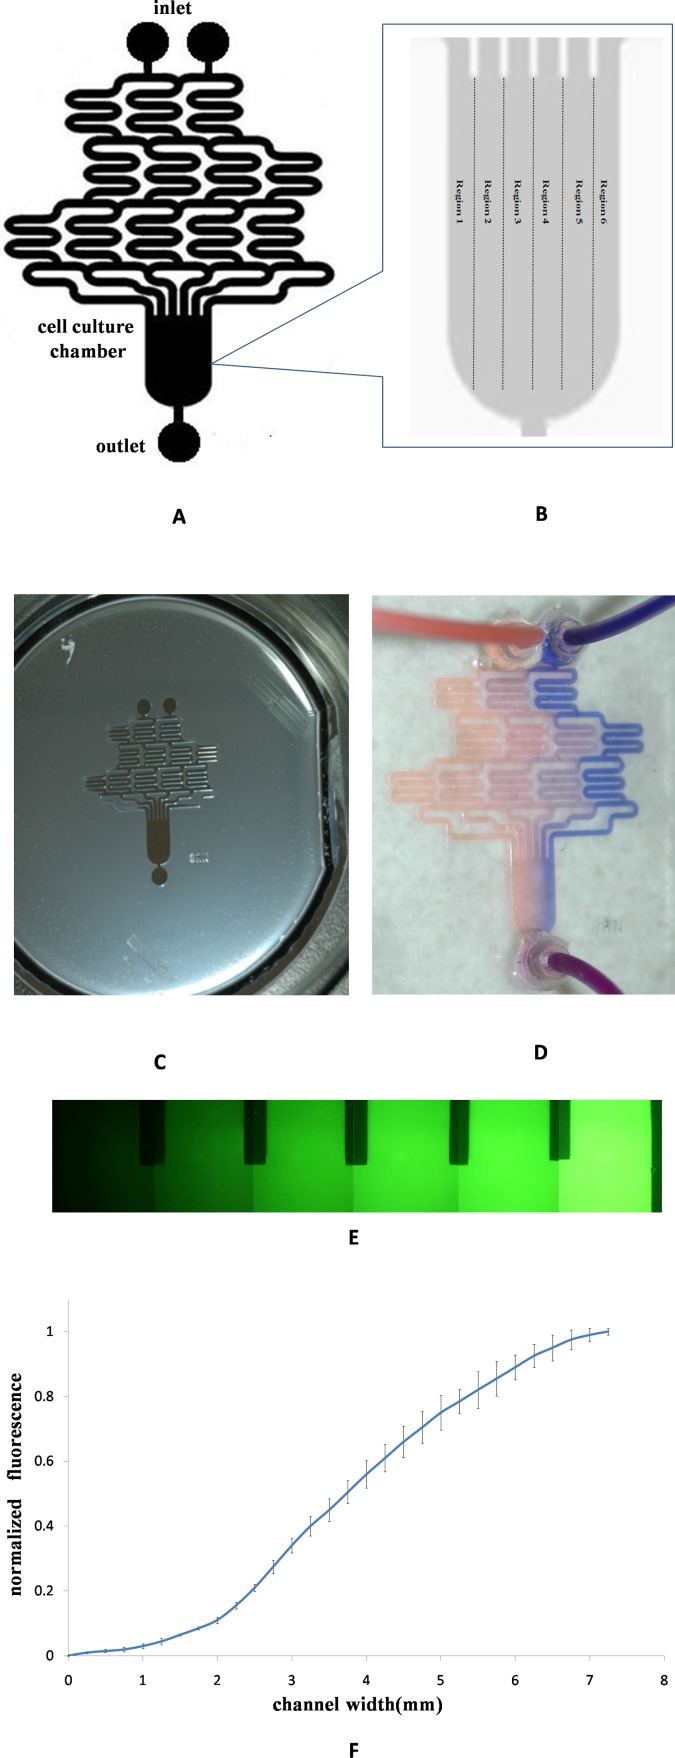
Figure 1.
Chip fabrication and concentration gradients generation. (a) Schematic of gradient microfluidic chip. (b) Divided the cell culture chamber into six regions. (c) The SU-8 mold of gradients microfluidic chip. (d) Using blue and orange dyes to make the gradient formation visualization. (e) Using fluorescein to quantitatively analyse gradient profile. (f) The relationship between fluorescent intensity and the width of cell culture chamber.

