Figure 1.

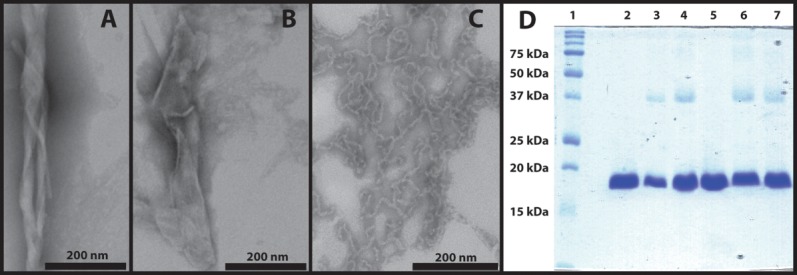
Characterization of thermally induced γD-crystallin aggregates. A. TEM image of thermally induced aggregates with twisted sheet morphology. B. TEM image of thermally induced aggregates with flat sheet morphology. C. Acid-induced amyloid fibers. D. SDS-PAGE analysis of thermally induced γD-crystallin aggregates. Lanes from left: (1) Molecular weight marker; (2) native γD-crystallin (S84C); (3) thermally induced aggregates of γD-crystallin (S84C); (4) thermally induced aggregates of γD-crystallin (S84C) with 2-mercaptoethanol; (5) native wild type γD-crystallin; (6) thermally induced aggregates of wild type γD-crystallin; (7) thermally induced aggregates of wild type γD-crystallin with 2-mercaptoethanol. Image C is reproduced from data described in Ref.11.
