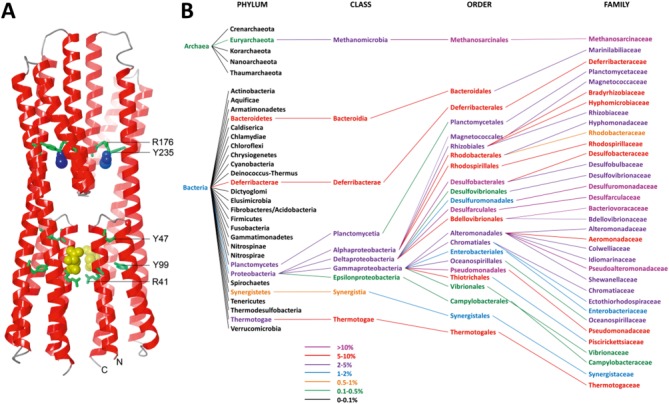
Figure 2.

(A). Three dimensional structure of the McpS sensor domain. Bound malate and acetate are shown in yellow and blue, respectively. Conserved amino acids (numbering according to Fig. 1) are depicted in green. (B). Phylogenetic distribution of species with HBM domain containing chemoreceptors. Data were derived from the analysis of the complete set of chemoreceptor sequences that were used as seed for the generation of the HMM. Phyla shown in black contain chemoreceptors (protein that are detected by PS50111), but not those containing HBM domains. The color coding corresponds to the relative abundance of chemoreceptors with an HBM domain over the total number of chemoreceptors.
