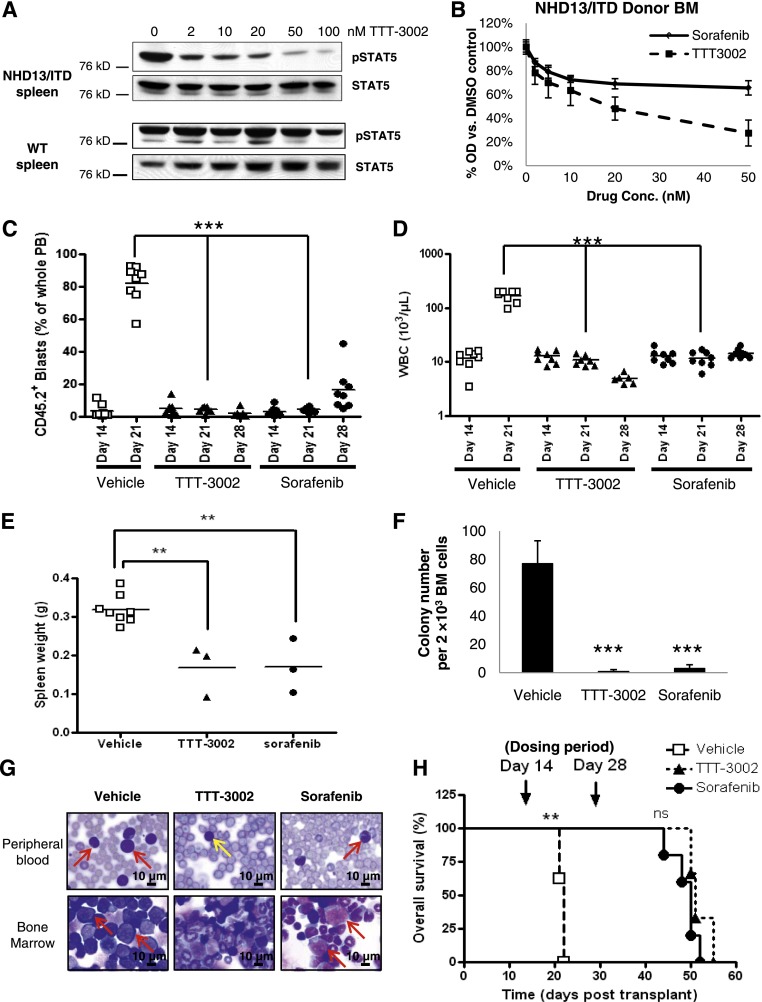
Figure 4.
TTT-3002 improves survival and measures of disease in the NHD13/ITD transgenic mouse model of AML. (A) Cells were harvested from the spleens of age-matched WT and leukemic NHD13/ITD mice (age 10 weeks). Expression of pSTAT5 relative to total STAT5 of WT and NHD13/ITD cells following 1 hour of treatment with TTT-3002 (0 to 100 nM) at equivalent protein loading and exposure time. (B) Whole BM was harvested from a CD45.2+ NHD13/ITD leukemic donor mouse (age 10 weeks) and used in cell proliferation studies following treatment with 0 to 50 nM TTT-3002 or sorafenib in vitro for 24 hours; error bars represent average ± SD. (C-H) In all, 5 × 10⁵ CD45.2+ donor NHD13/ITD leukemic cells and 5 × 10⁵ CD45.1+ WT helper cells were transplanted by tail vein injection into sublethally irradiated CD45.1+ WT recipients. Engraftment of CD45.2+ cells in PB was confirmed on day 14 by flow cytometry, and mice were divided into 3 treatment cohorts: TTT-3002 (n = 6; 6 mg/kg twice per day), sorafenib (n = 8; 10 mg/kg once per day), or vehicle (n = 8; 1 mM HCl twice per day). (C) Percentage of engrafted CD45.2+ leukemic cells in the PB on days 14, 21, and 28. (D) WBC counts on days 14, 21, and 28 (WBC, 103/µL) ***P < .001. (E) Splenomegaly is decreased in FLT3 TKI–treated mice. Spleens were harvested and weighed from vehicle-treated mice as they succumbed to disease, and spleens were harvested from mice in the TTT-3002–treated (n = 3; **P < .01) and sorafenib-treated (n = 3; **P < .01) cohorts on day 28 posttransplantation, corresponding with cessation of treatment. (F) TKI treatment impairs leukemic colony formation of whole BM harvested from vehicle-, TTT-3002–, and sorafenib-treated mice (n = 3 per cohort) at time points described in (E). Data represent average of 3 mice per cohort ± SD; ***P < .001. (G) Histopathology of PB and BM preparations (Wright-Giemsa stain) of representative mice from each cohort. PB and BM were harvested from mice at time points described in (E). Arrows indicate examples of leukemic blasts or atypical monocytes (red) in the BM and PB of vehicle- and sorafenib-treated mice. The PB image of the TTT-3002 representative mouse contains normal mature lymphocytes (yellow arrow), but blasts and atypical monocytes are virtually absent. Slides were imaged on an Olympus BX46 microscope with an Olympus DP72 camera at ×100 magnification with 1.3 aperture. Olympus cellSens Standard 1.5 image acquisition software was used. (H) Overall survival of vehicle- (n = 8), TTT-3002– (n = 3) and sorafenib- (n = 5) treated cohorts, with median time to death of 22, 51, and 50 days, respectively; **P < .01; ns, not significant.

