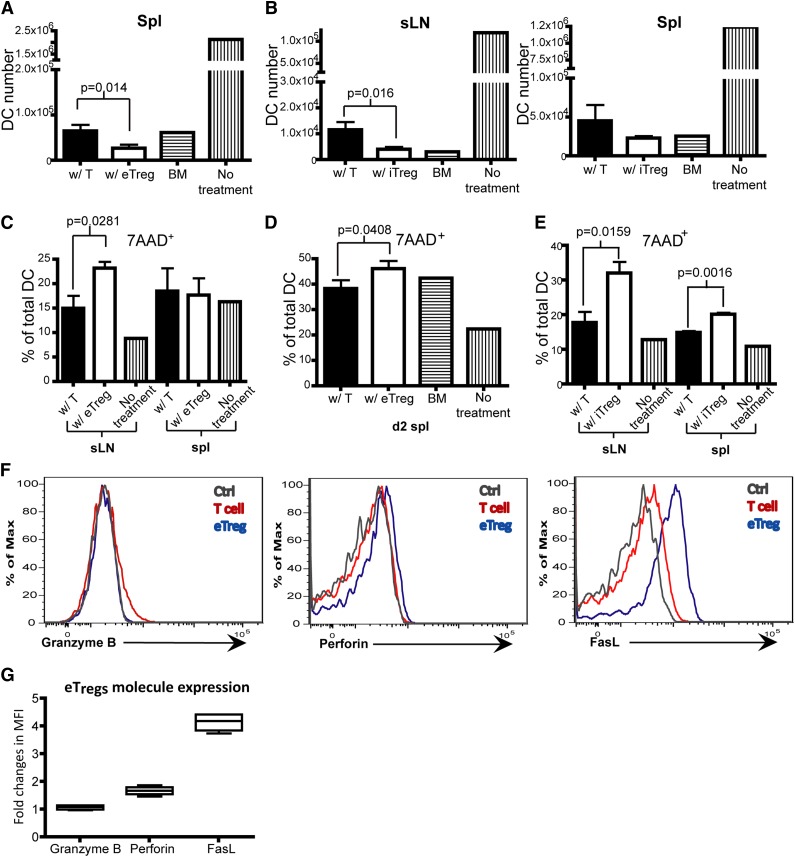
Figure 7.
Tregs promote DC death. (A-G) Flow analysis on DCs from sLNs and spleens of recipient mice that were transplanted with T cells or eTregs or iTregs (with TCD BM) 1 day or 2 days prior to analysis. (A) Total DC number on day 2 in the spleen of mice transplanted with T cells or eTregs on day 2 posttransplant. (B) Total number of DCs on day 1 in sLNs and spleen of mice transplanted with T cells or iTregs. (C-E) The percentage of 7AAD+ DCs in total DCs from sLNs or the spleen of mice transplanted with T cells or eTregs on day 1 (C) or day 2 (spleen only) (D). (E) The percentage of 7AAD+ DCs of total DCs from sLNs or spleens of mice transplanted with T cells or iTregs on day 1. (F) Flow analysis of eTregs from spleens 3 days posttransplant. (G) Box plot of fold changes in MFI for granzyme B, perforin and FasL from eTregs. N = 3 to 4 mice per group (1 mouse for controls) with representative data from 2 different experiments.

