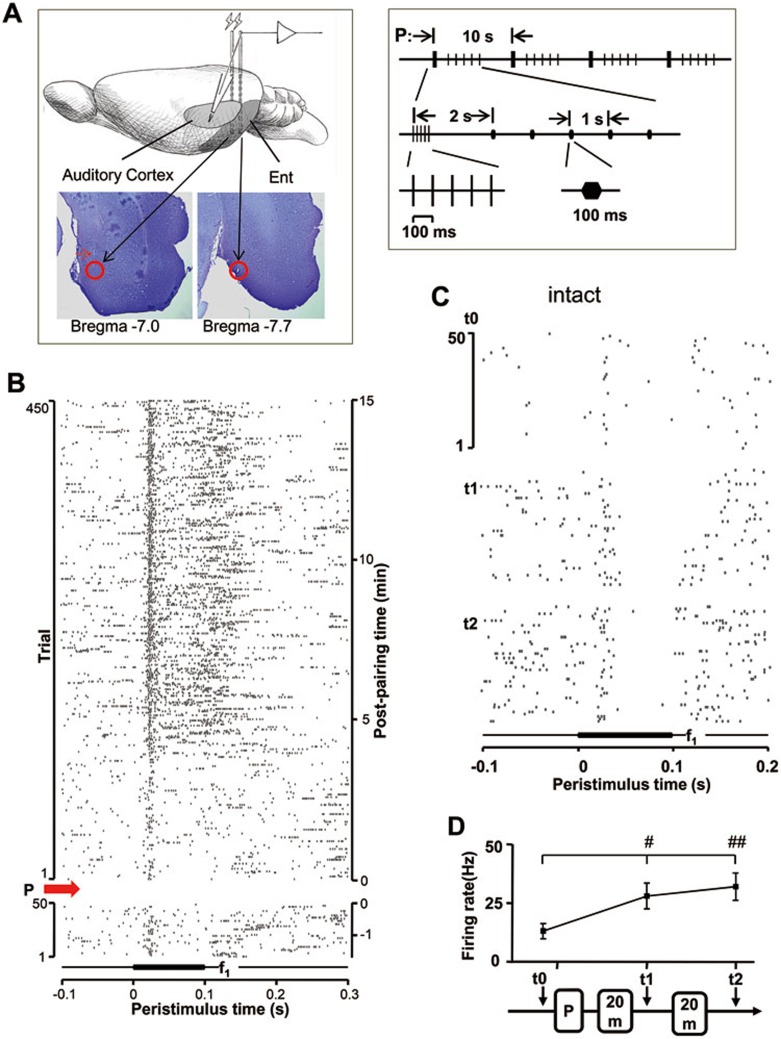
Figure 11.
Enhanced auditory response after electrical stimulation of the entorhinal cortex in anesthetized rats. (A) Experimental preparation (left panel) and details of the stimulus pairings (P) (right panel). (B) Raster plots showing neuronal responses in the auditory cortex before and after stimulus pairings. Pairing sessions started at 0 min indicated on the right vertical axis (marked by a red arrow at the left vertical axis). An auditory stimulus (100-ms duration) was repeatedly delivered at time 0 in the horizontal axis with an inter-stimulus interval of 2 s. Only partial raster data of 400 ms is shown here. Two stimulating electrodes simultaneously activated two sites of the entorhinal cortex to provide a larger opportunity to activate auditory cortex projection neurons. Lesions were made at the end of the experiment (following the method described in64), shown by red circles in the Nissl-stained sections. The truck of the other stimulation electrode was identified in the left panel marked by the red arrow. (C) Raster plots showing auditory responses of another neuron before (t0) and after (t1 and t2) stimulus pairings. (D) Neuronal responses to the auditory stimulus before and 20 and 40 min after stimulus pairings for the neuron shown in C. Firing rates after stimulus pairings were compared with that before stimulus pairings. #P < 0.05 and ##P < 0.01, one-way ANOVA.

