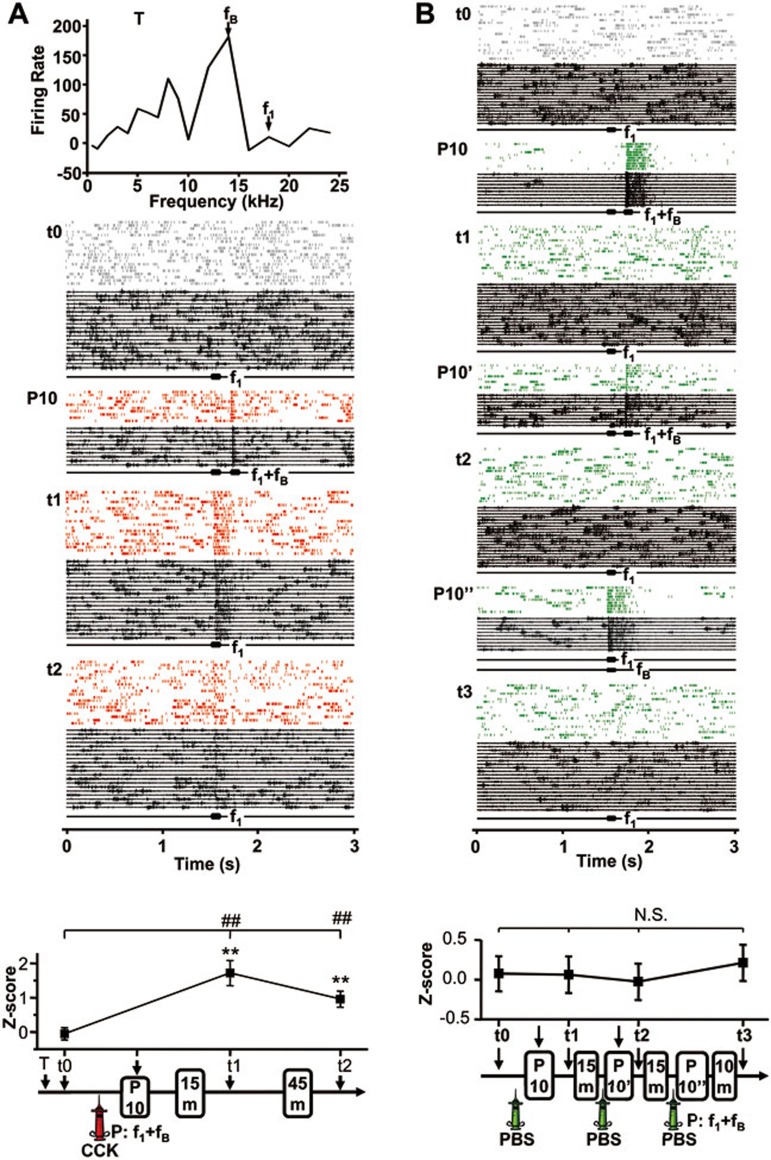
Figure 4.
Neuronal responses to a weak stimulus after pairing with a strong stimulus in the presence of CCK in anesthetized rats. (A) An unresponsive neuron in the auditory cortex became responsive after 10 pairings (P10) of f1 (18 kHz) and fB (14 kHz). Raster plots and raw traces show neuronal responses to f1before (t0) and after stimulus pairings (t1, t2). Z-scores were calculated based on differences between average neuronal firing during a 30-ms period after stimulus onset and spontaneous firing during a 30-ms period before stimulus onset. **P < 0.01, paired t-test (stimulus-evoked vs spontaneous firing); ##P < 0.01, one-way ANOVA. A frequency-response function was acquired at the beginning of the experiment (T). (B) Pairing of f1 and fB after local infusion of PBS did not induce a change in neuronal responses. Raster plots and raw traces show neuronal responses to f1 at different times before and after pairings of f1 and fB during three blocks of 10 trials (P10, P10', and P10”). Z-scores were calculated based on differences between average neuronal firing during a 90-ms period after stimulus onset and spontaneous firing during a 90-ms period before stimulus onset. N.S., not significant, one-way ANOVA.

