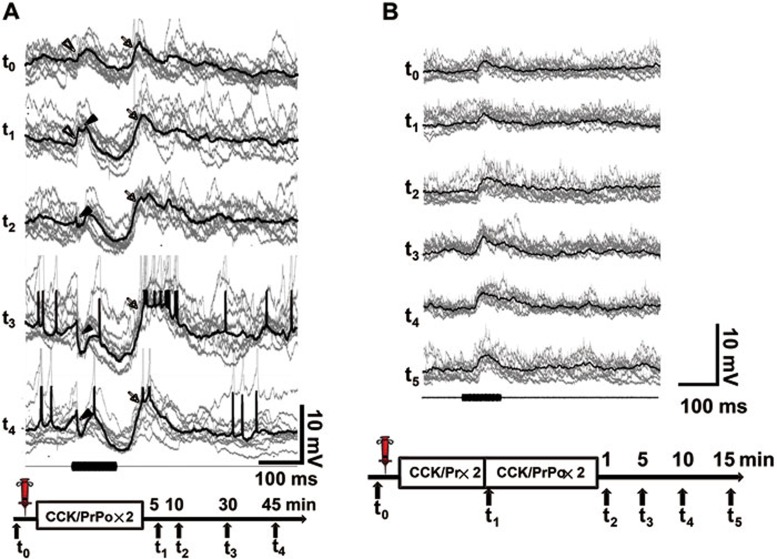
Figure 8.
Time course of evoked membrane potential after CCK infusion in the auditory cortex of anesthetized guinea pigs. (A) Progressive changes after CCK infusion in the auditory cortex of an anesthetized guinea pig. Intracellular recordings show averaged responses (thick trace) and individual trial responses (thin trace) to repeated auditory stimuli before (t0) and at different times (t1-t4) after infusion of CCK and two pairings of auditory stimulus and current injection (CCK/PrPo×2). Open arrowheads show the initial EPSP component before and after the pairings (t0 and t1). Filled arrowheads show an early inhibitory component that appeared after the pairings (t1-t4). Arrows show the second EPSP component before and after the pairings (t0-t4). Scale bars apply to all traces. Experimental timeline is illustrated below the traces. (B) Change in neuronal responses after the pairings of presynaptic and postsynaptic activity in the presence of CCK. Traces show neuronal responses (averaged, thick; individual trials, thin) to the auditory stimulus before (t0) and after local infusion of CCK (t1-t5). The t1 measurement was carried out after two presentations of the auditory stimulus alone (CCK/Pr×2), and the t2-t5 measurements were carried out at different times after two pairings of the auditory stimulus and depolarization (CCK/PrPo×2) as shown in the below experimental timeline.

