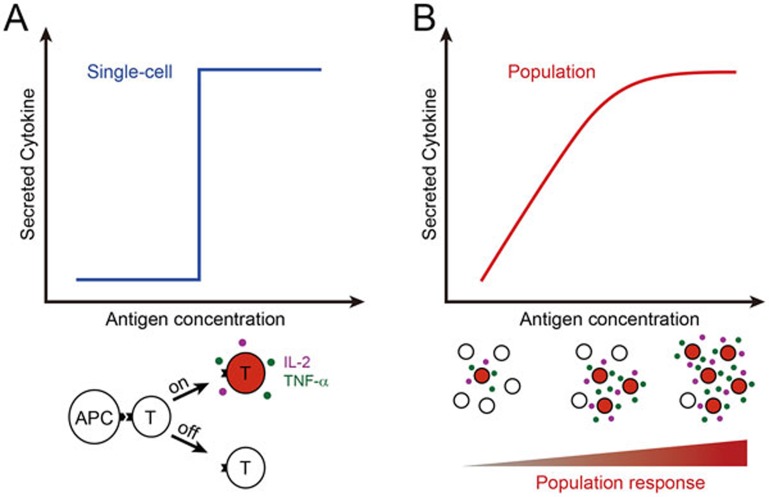
Figure 1.
Digital T cell response to antigen stimulation. After the engagement with an APC, T cell either switches “on” (red filling) with cytokine production or remains “off” (white filling) (A). Higher antigen concentration does not increase individual T cell cytokine release (blue graph), but the proportion of responding cells is higher. On average, this results in a gradually increasing response to higher antigen concentrations, as illustrated by the red graph and the schematic below (B).

