
Figure 10.
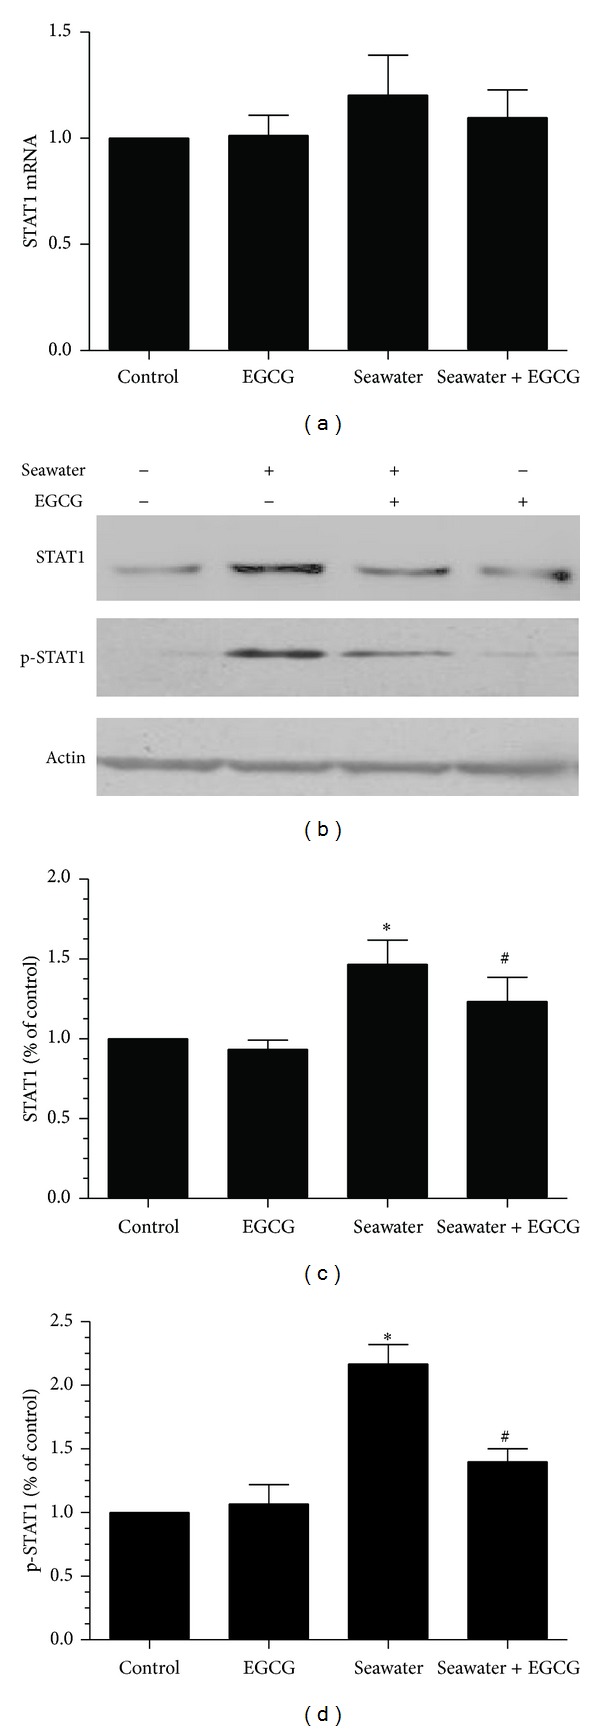
Effect of EGCG pretreatment on the expression of STAT1 and p-STAT1 in the cell line NR8383. (a) mRNA expression of STAT1 in NR8383 cells. (b) Representative western blot for the phosphorylated STAT1 and the total STAT1 protein in different groups. (c)-(d) Summarized data of the total (c) and the phosphorylated (d) STAT1 protein level in different groups. Data represent three independent experiments and are expressed as mean ± SEM; *P < 0.05 versus control group; # P < 0.05 versus seawater group.