
Figure 6.
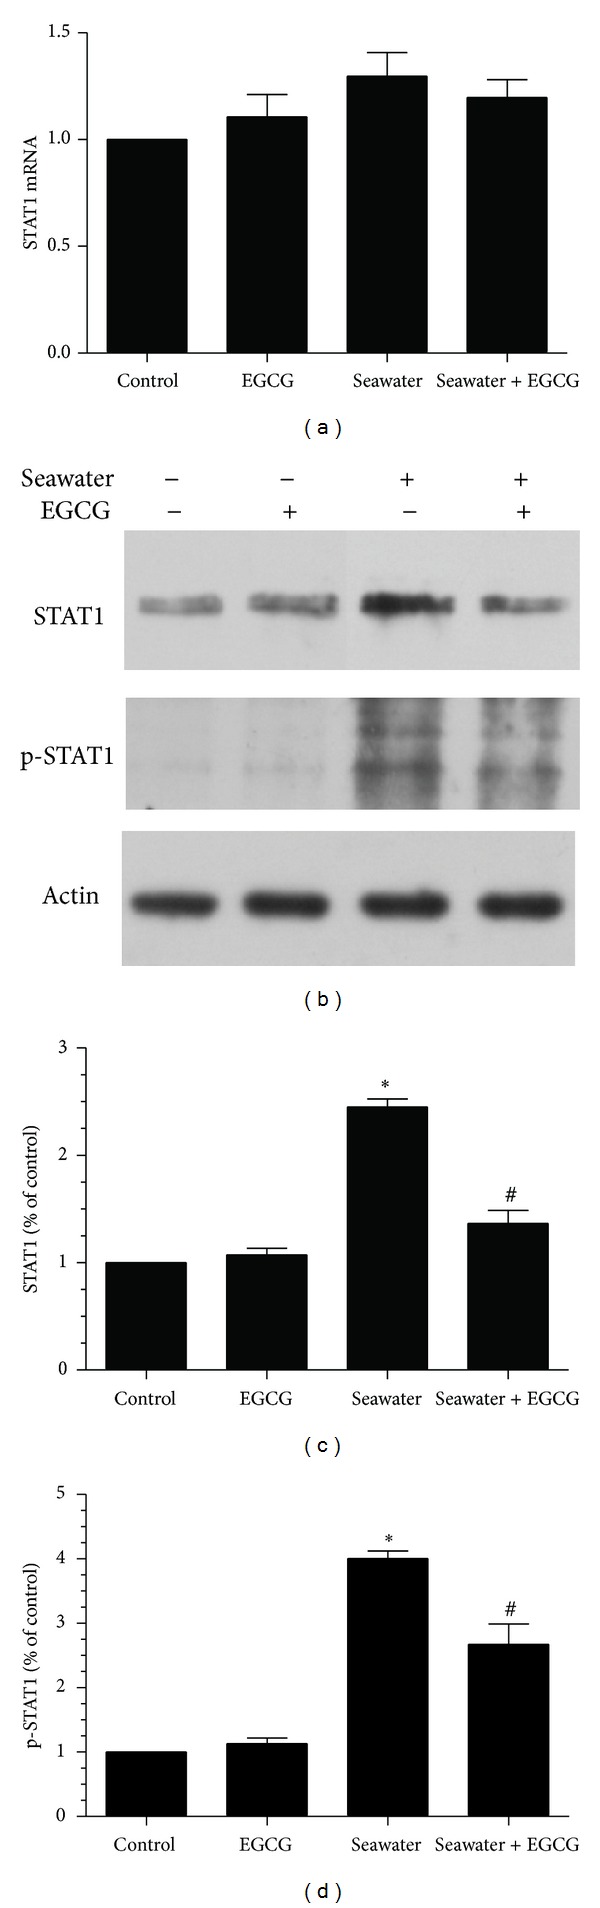
Effects of EGCG pretreatment on the expression of STAT1 and p-STAT1 in rats. (a) mRNA expression of STAT1 in rats; (b) representative western blot for the phosphorylated STAT1 and the total STAT1 protein in different groups. Samples were prepared for western blot analysis using anti-STAT1, anti-p-STAT1, and anti-β-actin; (c)-(d) summarized data of the total (c) and the phosphorylated (d) STAT1 protein in different groups. Data represent three independent experiments and are expressed as mean ± SEM; *P < 0.05 versus control group; # P < 0.05 versus seawater group.