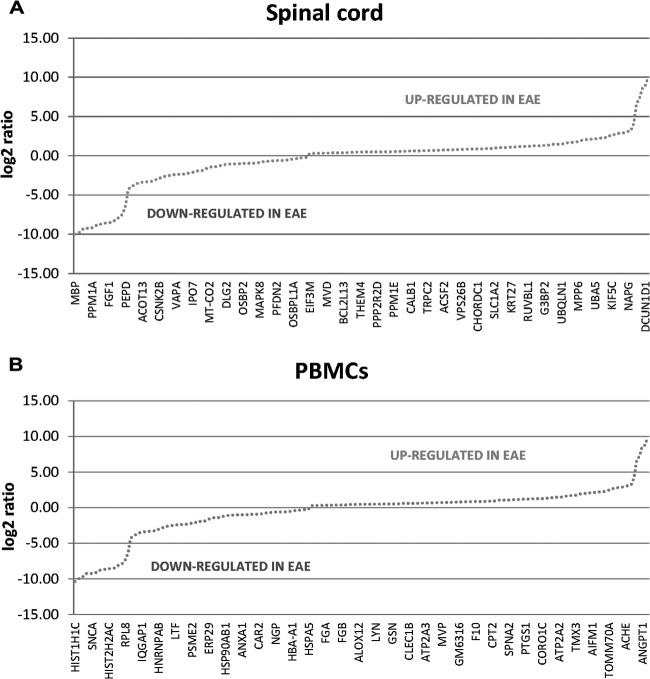
Fig. 2.
Plot of the distribution of log2 ratio values representing differentially abundant proteins between EAE and sham-induced mice by relative protein quantitation via spectral counting. Representations of the proteins up-regulated (positive log2-fold changes) and down-regulated (negative log2-fold changes) in disease from the comparative proteomic analysis of (A) spinal cord and (B) membrane protein-enriched fraction of PBMCs.

