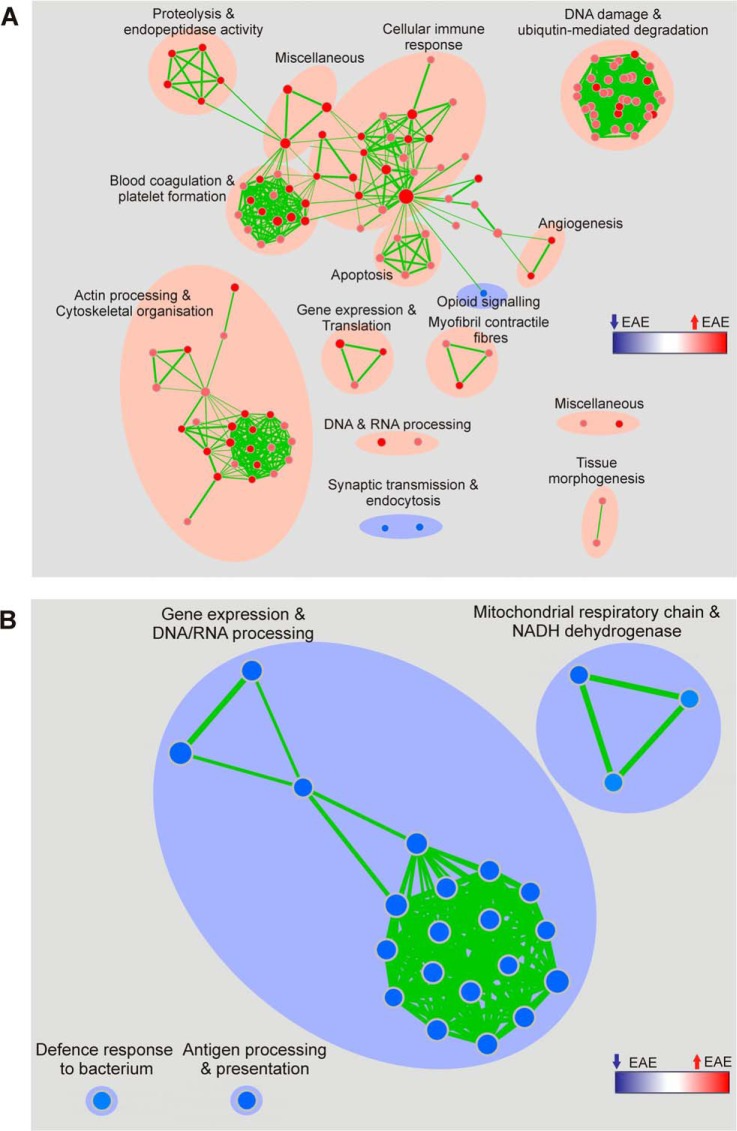
Fig. 5.
Enrichment map representations of the GSEA results obtained for the comparative proteomics analyses of spinal cord and membrane protein-enriched PBMC fraction isolated from EAE and sham-induced mice. Biological processes that are perturbed in (A) the spinal cord and (B) PBMCs are annotated. Node color and shading intensity represents the statistical significance of enrichment of a particular gene set, whereas larger node sizes indicate that more genes have contributed.

