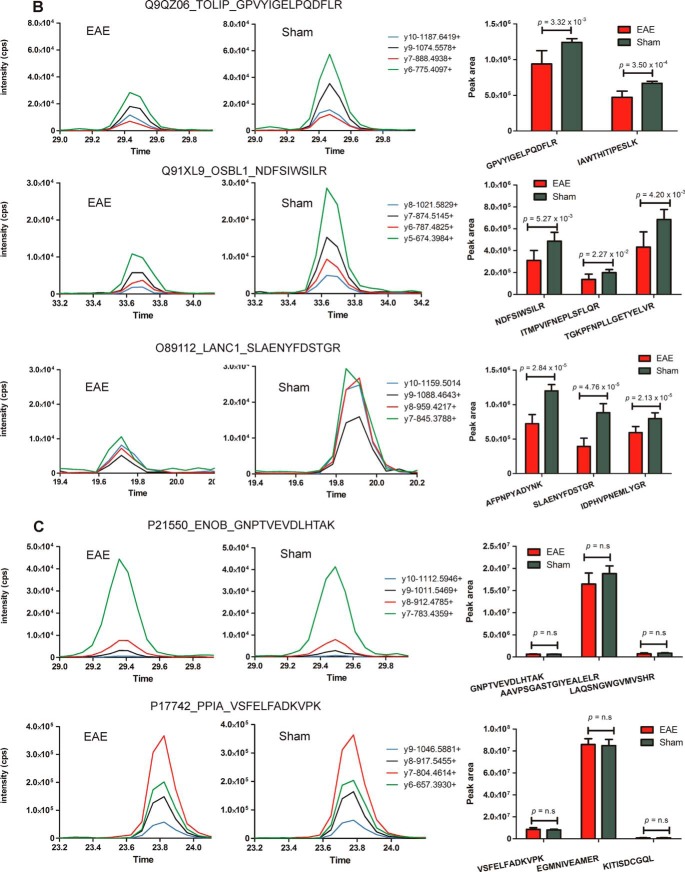
Fig. 8.
Targeted mass spectrometry analysis of a subset of differentially abundant proteins identified within the spinal cord tissue of EAE and sham-induced mice. Proteins validated to be (A) up-regulated and (B) down-regulated in EAE spinal cord or (C) “housekeeping” proteins (ENOB and PPIA) exhibiting similar levels of expression between sham and EAE mice Graphs are representative extracted ion chromatograms (XICs) for specific peptides derived from dysregulated proteins sampled from each group. Bar charts represent the average peak intensity (counts per second, cps) for peptides quantified in EAE (red) and sham (green) mice (three biological replicates per group, two technical replicates per peptide). A Student's t test was performed on the peak areas of each quantified peptide to test for statistical differences between EAE and sham with p values ≤ 0.05 considered statistically significant. n.s refers to peptides that were analyzed by MRM but were deemed not statistically significant.


