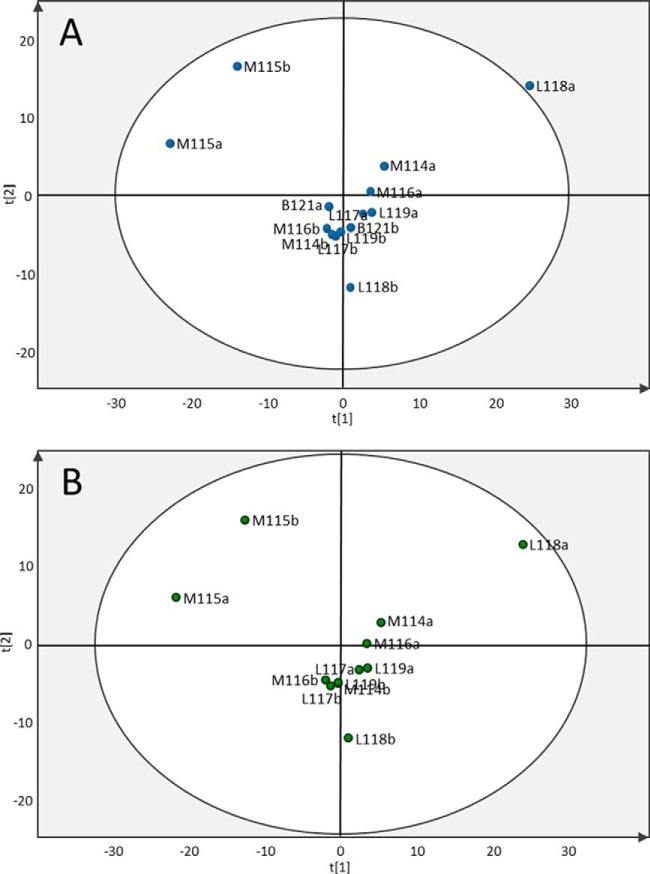
Fig. 2.
Principal component analysis (PCA) performed on the 382 overlapping proteins in the two iPool samples. A, the PCA score plot of components t1 and t2 shows the most variation in the data. L118a is shown as a possible outlier value based on protein expression (i.e. outside the 95% confidence interval, which is indicated by the circle). B, PCA of samples from mesothelioma and lung adenocarcinoma patients only (L118a is now just within the 95% confidence interval). M, mesothelioma; L, lung adenocarcinoma; B, benign. The number indicates the iTRAQ ion used to label the individual sample, and lowercase “a” and “b” indicate iPool 1 and iPool 2, respectively.

