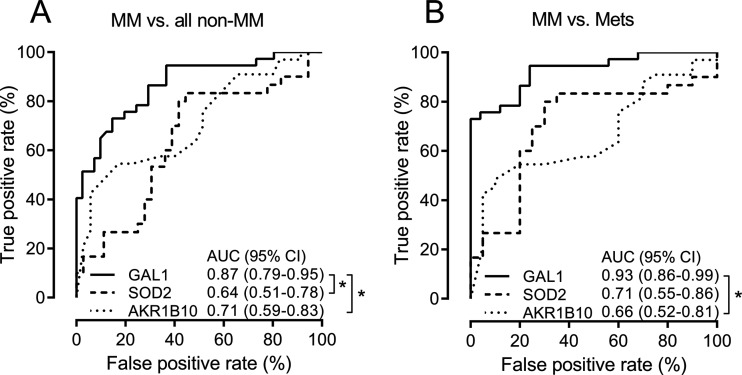
Fig. 5.
Receiver operating characteristic (ROC) curves. Biomarker candidate proteins with ROC curves significantly differentiating from an area under the curve (AUC) of 0.5 are plotted for comparison. 95%CI, 95% confidence interval; GAL1, galectin 1; SOD2, superoxide dismutase 2; AKR1B10, aldo-keto reductase 1B10; MM, malignant mesothelioma; Mets, metastatic carcinoma. *Significant difference between AUCs (p value < 0.05).

