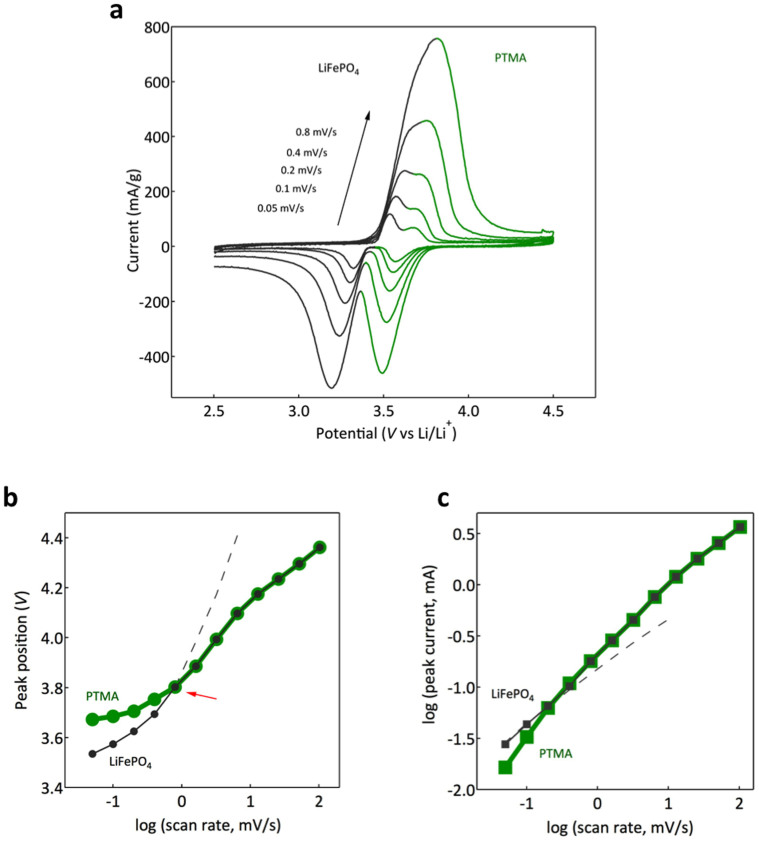
Figure 2. Cyclic voltammetry of the hybrid electrode.
(a), Voltammograms recorded between 2.5 and 4.5 V vs. Li/Li+ at different scan rates. The two cathodic peaks are separated at low scan rates and overlap at higher scan rates. (b), Cathodic peaks position function of the scan rate for the hybrid electrode. Red arrow marks the onset of the overlapping region. No distinct LiFePO4 redox peak is observed beyond. (c), Cathodic peak current function of the scan rate for the hybrid electrode. The slope of the log-log dependence is indicative of the charge transfer kinetics. The dashed curves in (b), and (c), are extrapolated from the voltammetry scan of the LiFePO4 electrode (see SI).

