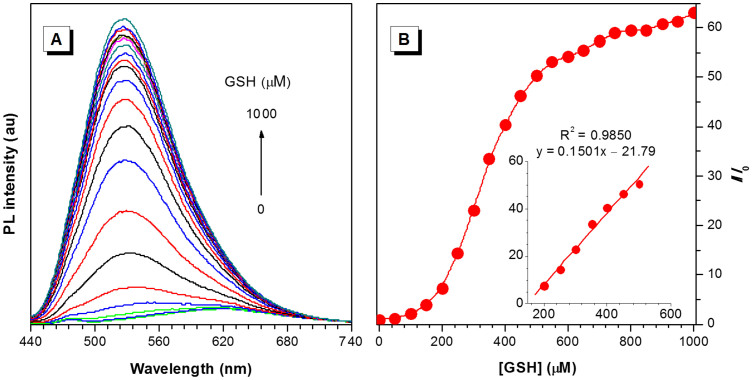
Figure 4. Glutathione (GSH) quantification by TPE-DCV.
(A) Emission spectra of TPE-DCV (3 μM) in the presence of different concentrations of GSH in a water/ethanol mixture (68:32, v/v). (B) Plot of relative emission intensity (I/I0) at 520 nm versus GSH concentration. Inset: plot of I/I0 at 520 nm of TPE-DCV upon addition of GSH (200–500 μM). I0 denotes the intensity of TPE-DCV in the absence of GSH. Excitation wavelength: 415 nm.

