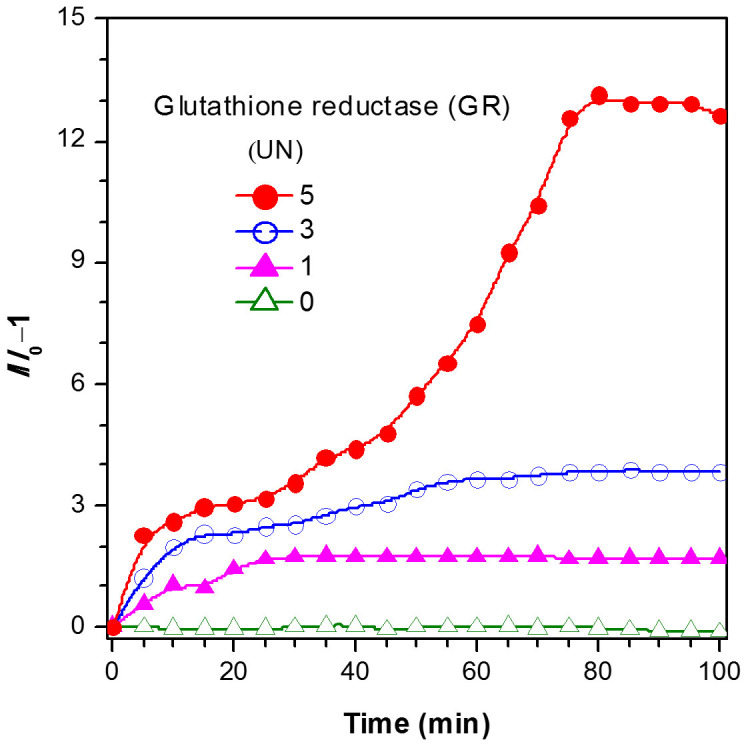
Figure 6. Kinetic monitoring of glutathione reductase activity.

Time-dependent fluorescence change of TPE-DCV (3 μM) at 520 nm in H2O/ethanol mixture (68:32, v/v) with GSSG (1 mM) in the presence of different concentrations of GR. I0 denotes the fluorescent intensity of TPE-DCV with GSSG before addition of GR.
