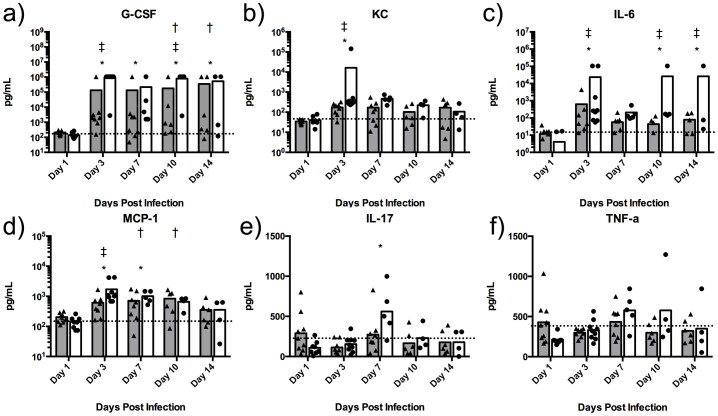
Figure 5. Blood serum chemokine/cytokine analysis.
Levels of individual chemokines/cytokines in plasma (pg/ml) of animals infected with HBPUB10303a (closed circles) or K96243 (closed triangles) compared to the uninfected control animals (dashed line). The symbols represent values of individual animals. The bars indicate the mean for each group and the dashed line represents the mean for uninfected control animals. The asterisk (*) indicates significantly different values when comparing HBPUB10303a to the uninfected control animals, p < 0.05. The single cross (†) represents significantly different values when comparing K96243 to the uninfected controls, p < 0.05. The double cross (‡) indicates significantly different values when comparing HBPUB10303a to K96243, p < 0.05.

