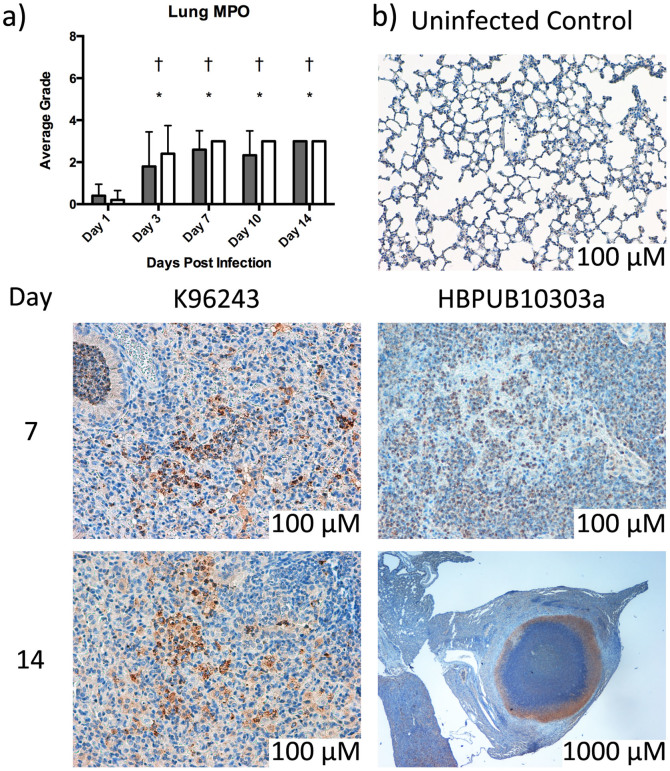
Figure 7. Immunohistochemistry.
(a) Immunohistochemistry scoring assigned for lung sections after microscopic examination. Bars represent mean ± SEM of animals infected with HBPUB10303a (white bars) or K96243 (gray bars). The asterisk (*) indicates significantly different values when comparing HBPUB10303a to the uninfected control animals, p < 0.05. The single cross (†) represents significantly different values when comparing K96243 to the uninfected controls p < 0.05. The double cross (‡) indicates significantly different values when comparing HBPUB10303a to K96243 p < 0.05. (b) Representative images from MPO stained lungs from mice infected with K96243 and HBPUB10303a at days 7 and 14 post-infection.

