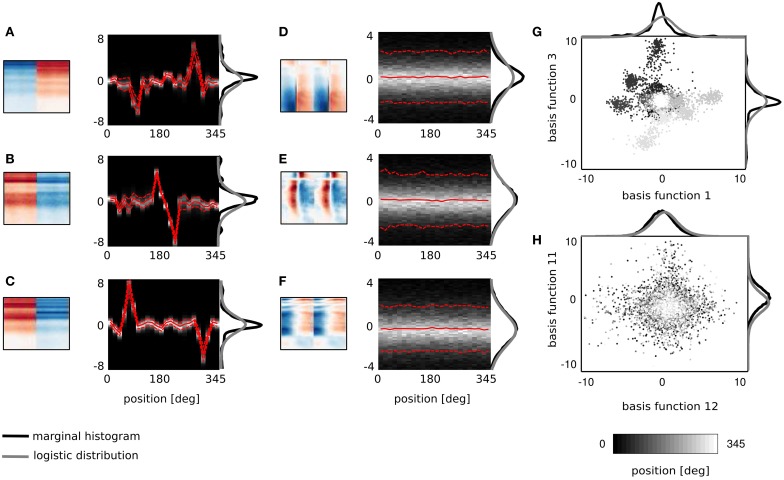
Figure 3.
Spatial sensitivity of basis functions. (A–F) Spectrotemporal basis functions and associated conditional histograms of linear coefficients s. Solid red lines mark means and dashed lines limits of plus/minus standard deviation. (G,H) Example pairwise dependencies between monaural and binaural basis functions respectively. Each point is one sound and grayscale corresponds to its spatial position.

