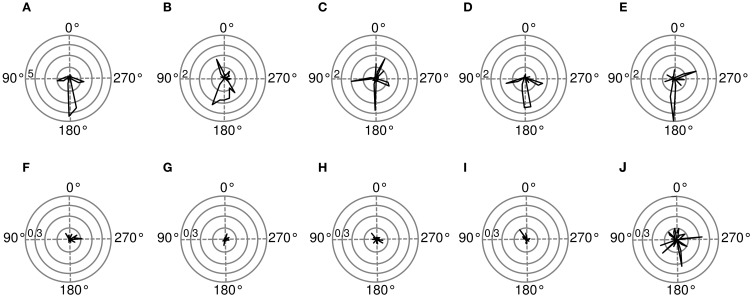
Figure 9.
Spatial sensitivity quantified with Fisher information. Polar plots represent area surrounding the listener, black lines mark Fisher information  at each angular position. Each subfigure corresponds to a basis function on the previous figure marked with the same letter. (A–E) Exemplary binaural basis functions (F–J) exemplary monaural features. Please note different scales of the plots.

