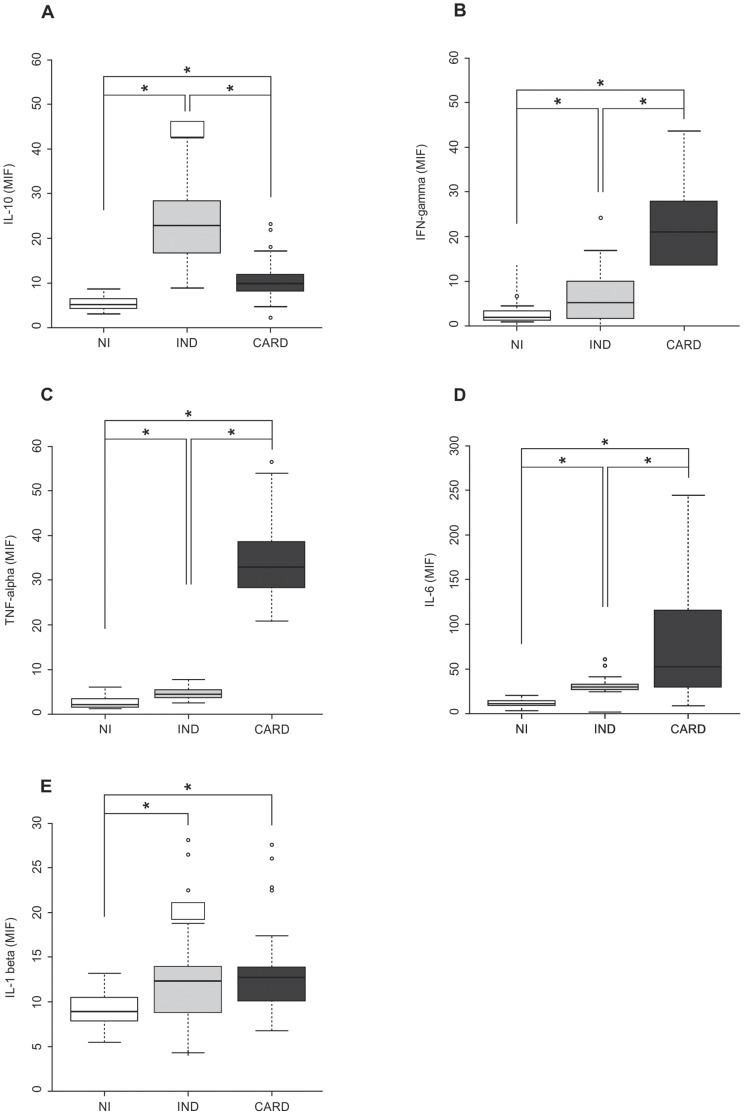
Figure 1. Analyses of plasma cytokine levels and their association with cardiac morbidity expressed by the clinical classification.
The analysis of plasma levels was performed as described in the material and methods section. The groups evaluated were: NI (n = 24, white box), IND (n = 82, light gray box), and CARD (n = 94, dark gray box). The results were expressed by mean intensity of fluorescence (MIF). (A) Plasma IL-10 levels in NI, IND, and CARD groups and their association with cardiac morbidity. (B) Plasma IFN-γ levels in NI, IND, and CARD groups and their association with cardiac morbidity. (C) Plasma TNF-α levels in NI, IND, and CARD groups and their association with cardiac morbidity. (D) Plasma IL-6 levels in NI, IND, and CARD groups and their association with cardiac morbidity. E) Plasma IL-1β levels in NI, IND, and CARD groups and their association with cardiac morbidity. Significant differences (P-value<0.05) in the charts are identified by connecting lines and the symbol (*) for comparisons between the groups.

