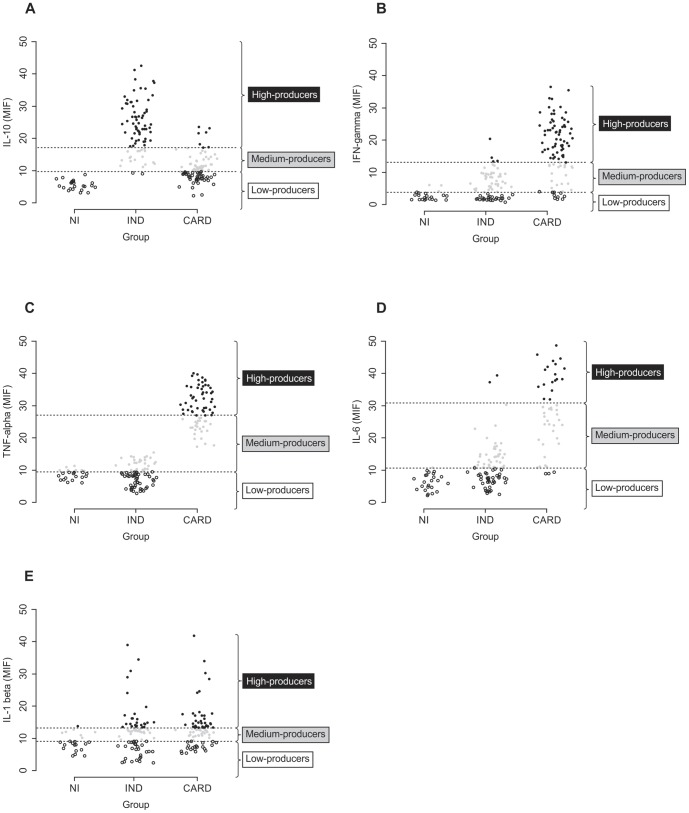
Figure 3. Establishing the concept of low, medium and high cytokine producers.
A) Representative scatter plot graph of plasma IL-10 used to establish the cut-off to define low, medium, and high cytokine producers. B) Representative scatter plot graph of plasma IFN-γ used to establish the cut-off edge to define low, medium, and high cytokine producers. C) Representative scatter plot graph of plasma TNF-α used to establish the cut-off to define low, medium, and high cytokine producers. D) Representative scatter plot graph of plasma IL-6 used to establish the cut-off to define low, medium, and high cytokine producers. E) Representative scatter plot graph of plasma IL-1β used to establish the cut-off to define low, medium, and high cytokine producers. Low cytokine producers were defined by values of lower than the first tertile. Medium cytokine producers were defined by values equal to or lower than the second tertile, while high cytokine producers were defined by values higher than or equal to the second tertile. Results were considered significant with a P-value<0.05.

