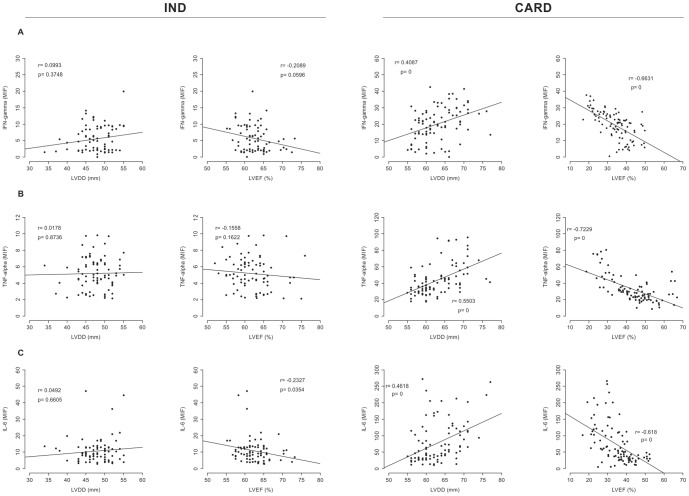
Figure 5. Correlation analysis between plasma IFN-γ, TNF-α, IL-6 levels, and echocardiographic variable markers of cardiac morbidity.
A) Correlation analysis between plasma IFN-γ and cardiac function variables in the IND (n = 82, first column) and CARD (n = 94, second column) groups. B) Correlation analysis between plasma TNF-α and cardiac function variables in the IND (n = 82, first column) and CARD (n = 94, second column) groups. C) Correlation analysis between plasma IL-6 and cardiac function variables in the IND (n = 82, first column) and CARD (n = 94, second column) groups. Correlation analysis was performed using the Spearman correlation coefficient, and results were considered significant when P<0.05. Significant differences (P-value) are indicated in each graph together with the r value.

