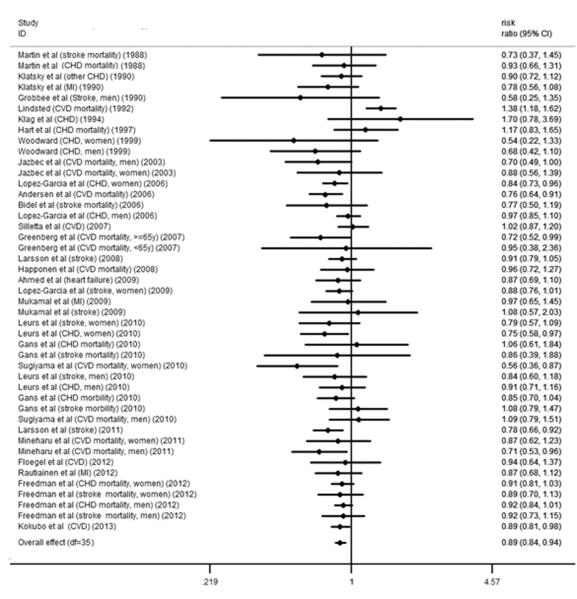
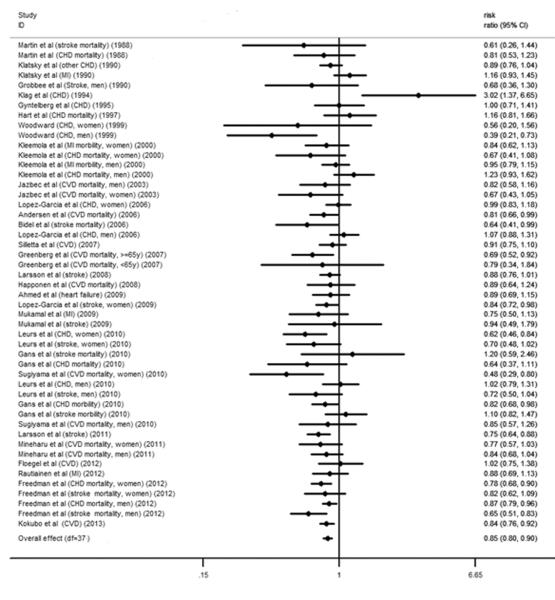
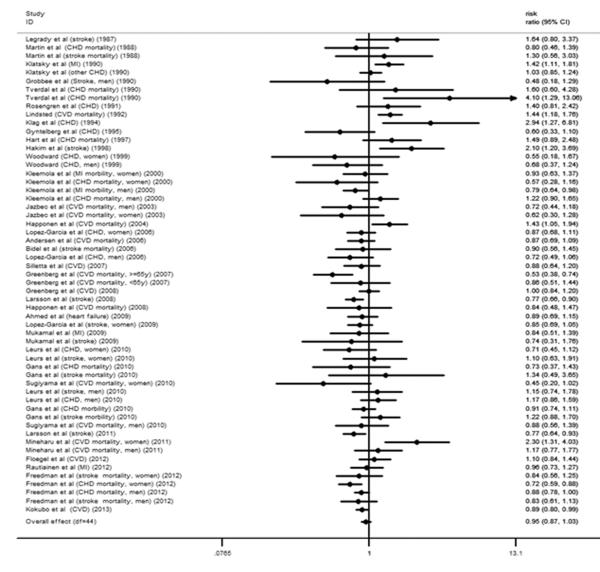
Figure 2.
A. Forest plot of the association between third highest level of coffee consumption (median consumption: 1.5 cups/d) and risk of CVD compared to the lowest level (median consumption: 0 cup/d). The overall effect was obtained from a fixed-effects model that accounted for correlated outcomes. MI means myocardial infarction incidence; CVD means cardiovascular disease incidence; stroke means stroke incidence. B. Forest plot of the association between second highest level of coffee consumption (median consumption: 3.5 cups/d) and risk of CVD compared to the lowest level (median consumption: 0 cups/d). The overall effect was obtained from a fixed-effects model that accounted for correlated outcomes. MI means myocardial infarction incidence; CVD means cardiovascular disease incidence; stroke means stroke incidence. C. Forest plot of the association between highest level of coffee consumption (median consumption: 7 cups/d) and risk of CVD compared to the lowest level (median consumption: 0 cups/d). The overall effect was obtained from a fixed-effects model that accounted for correlated outcomes. MI means myocardial infarction incidence; CVD means cardiovascular disease incidence; stroke means stroke incidence.


