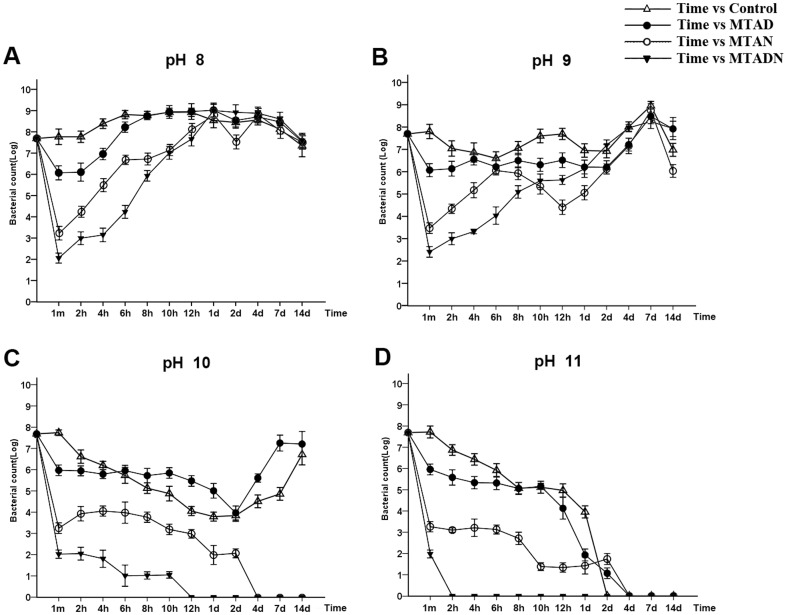
Figure 1. Evaluation of E. faecalis resistance to alkaline environments.
E. faecalis was challenged with pH 8, pH 9, pH 10, and pH 11 conditions after being initially treated with MTAD, MTAN, or MTADN for 1 min. Furthermore, E. faecalis without pretreatment with drugs was used as a control. Graphs of the E. faecalis survival rates vs. time were plotted. The y-axis represents the logarithmic value of the viable cell concentration (CFU/ml), and the x-axis represents the time of challenge.

