
Figure 7.
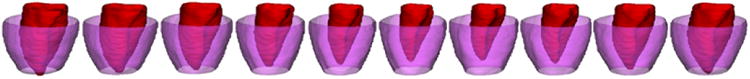
3D endocardial (in red) and epicardial (in purple) surfaces of frames 1, 4, 7, 10, 13, 16, 19, 22, 25, and 28 of a representative canine echocardiographic sequence segmented using our approach.
Official websites use .gov
A
.gov website belongs to an official
government organization in the United States.
Secure .gov websites use HTTPS
A lock (
) or https:// means you've safely
connected to the .gov website. Share sensitive
information only on official, secure websites.
3D endocardial (in red) and epicardial (in purple) surfaces of frames 1, 4, 7, 10, 13, 16, 19, 22, 25, and 28 of a representative canine echocardiographic sequence segmented using our approach.