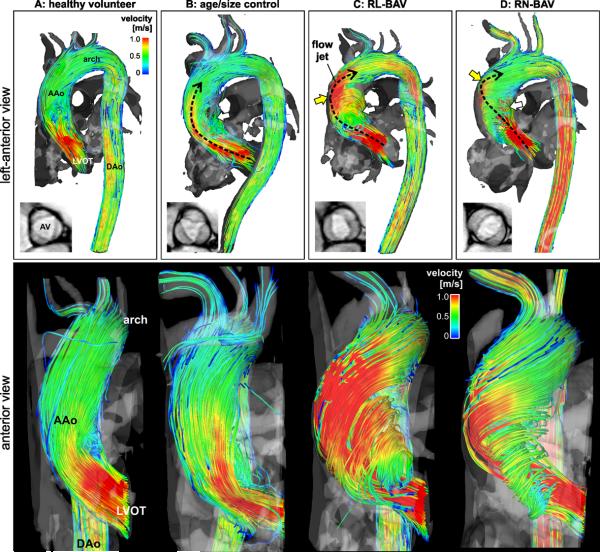
Figure 2.
Top row: 3D streamline visualization of peak systolic blood flow in patients with BAV (C,D) compared to an aorta size matched control subject (B) and a healthy volunteer (A). Note the presence of distinctly different 3D outflow flow jet patterns (black dashed arrows) in the ascending aorta (AAo) for patients B-C. Bottom row: 3D flow patterns in the left ventricular outflow tract (LVOT) and ascending aorta (AAo) distal to the aortic valve. Note the different systolic AV outflow flow jet patterns (red color indicating high velocities > 1m/s) and wall impingement zones which correspond to variable exertion of high wall shear forces between different valve groups (C,D) and aorta size matched controls (B) and healthy volunteers (A).

