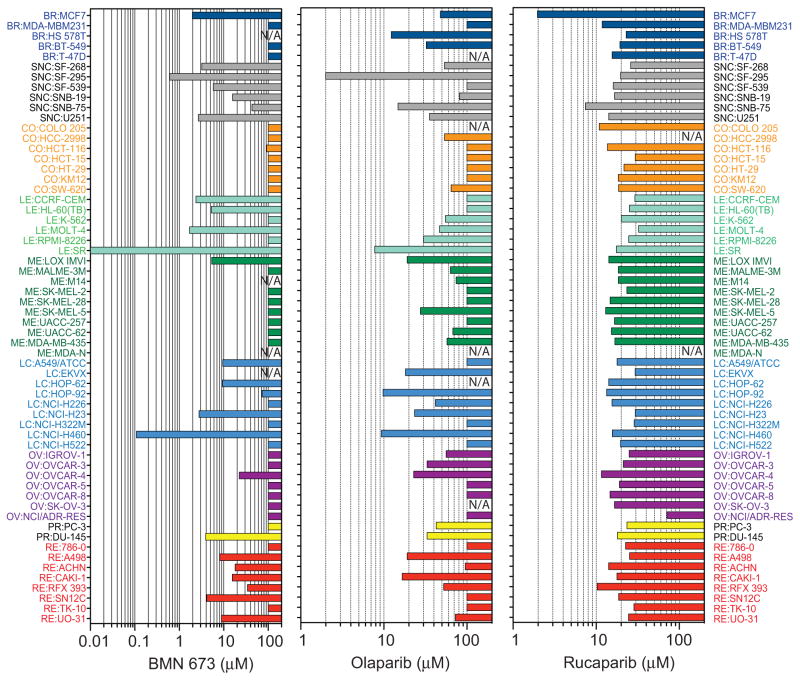
Figure 3. Comparison of the sensitivity patterns in the three PARP inhibitors across the NCI60 cell lines.
The IC50 (drug concentration that reduces cell survival down to 50%) obtained from the NCI60 databases (35, 41) (http://discover.nci.nih.gov/cellminer) is plotted for each cell line. Cell lines are colored according to tissue of origin (41). NA: data not available.

