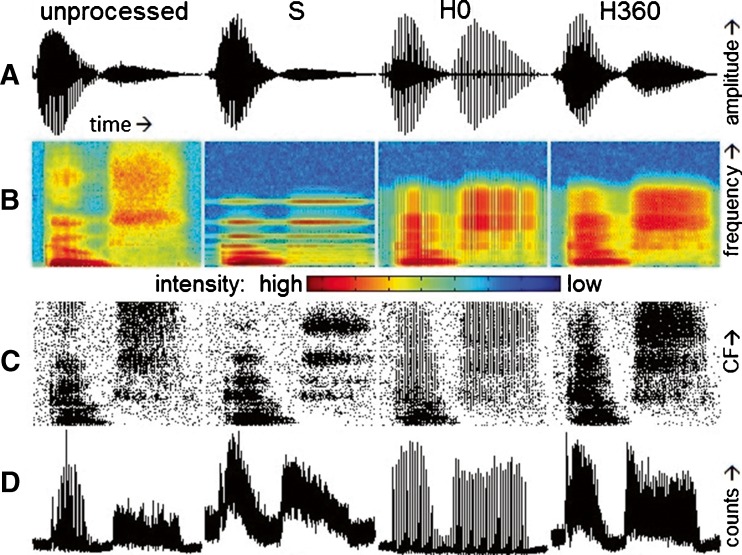
FIG. 2.
Plots of analyses of the CNC word “goose” in the absence of a masker allow for feature comparison among carriers, here all using Butterworth synthesis filters. Row A depicts time-domain waveforms, with intensity in arbitrary units on the vertical axis and time on the horizontal axis. Row B depicts spectrograms, with time on the horizontal axis, frequency from 0 to 10 kHz on the linear vertical axis, and intensity in arbitrary units encoded by color from blue (low) to red (high). Row C depicts modeled neural response PSTHs from 20 low-SR fibers per CF, with fiber CF ranging linearly from 0.1 to 7 kHz on the vertical axis, time on the horizontal axis, and a dot for each simulated action potential. Row D depicts summary PSTHs from 20 high-SR fibers, with counts on the vertical axis and time on the horizontal axis. The columns contain these depictions for unprocessed, S, H0, and H360—vocoded stimuli from left to right.

