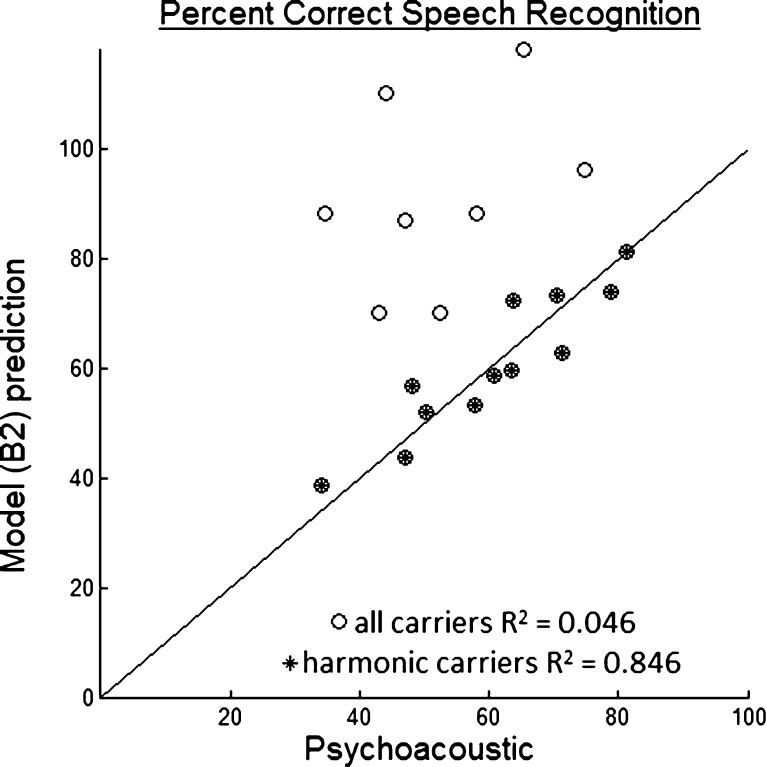
FIG. 5.
Measured and model-predicted percent correct speech recognition for each carrier, SNR, and synthesis filter type. The predicted scores with harmonic carriers, denoted by asterisks, lie along the measured-predicted diagonal, while the predicted scores with the sine and noise vocoders are much higher than psychoacoustic results. The model shown here, B2, used ρ TFS and ρ ENV predictors for medium-SR fibers only and had positive and significant term coefficients.

