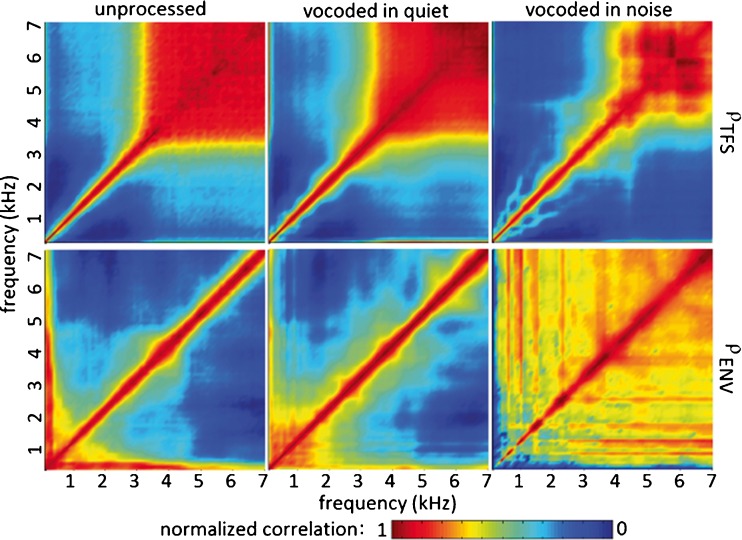
FIG. 6.
Across-fiber, within-stimulus neural correlation coefficients for TFS (first row) and envelope (second row). Columns show neural correlation coefficients calculated for all unprocessed stimuli, all vocoded stimuli in quiet, and all vocoded stimuli in noise from left to right. The horizontal and vertical axes depict modeled AN fiber CFs from 0.1 to 7 kHz, and color depicts the level of neural correlation from low (blue) to high (red).

