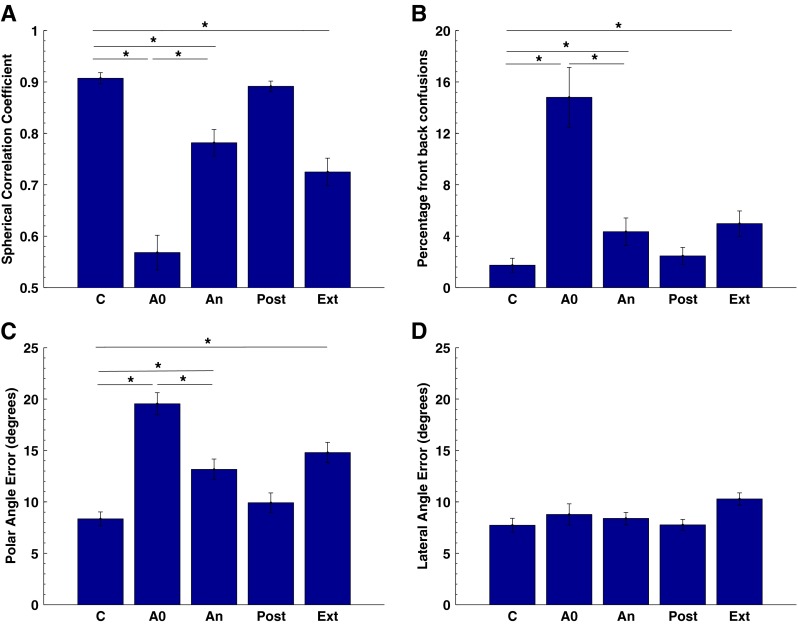
FIG. 3.

Group mean data for eight subjects where localization performance was assessed using the spherical correlation coefficient (A), the percentage of front–back confusions (B), the polar angle error (C) and the lateral angle error (D). C control pre-accommodation, A0 performance with acute exposure to the mould, An performance with the moulds on the last day of accommodation, Post performance immediately post-accommodation without the moulds, Ext performance a week or more post-accommodation with the moulds. Significant differences (P < 0.05) between conditions are indicated by an asterisk ‘*’.
